127 posters, 10 topics, 20 sessions, 127 authors
ePostersLive by SciGen Technologies S.A. All rights reserved.
UCSF 2024 Inquiry Symposium
Conference ePosters

P023
Cost-Effectiveness Analyses versus Back-of-the-Envelope Valuations: A Pilot Study
Poster Presenter
Authors
Part of Topic
Epidemiology & Population Sciences
Title: Cost-Effectiveness Analyses versus Back-of-the-Envelope Valuations: An Oncology Pilot Study
Introduction
Given the high price of oncology drugs, cost-effectiveness analyses (CEAs) for approved oncology drugs have become prevalent. These analyses guide health care systems, and impact healthcare budgets that consider the value a therapy is predicted to provide. Although these analyses are intended to be unbiased, this assumption has been challenged. Bell et al.’s pivotal study in the British Medical Journal identified that industry-sponsored CEAs were more than twice as likely to report to report favorable incremental cost effectiveness ratios (ICERs)1. More recently, Haslam et al. found that oncology industry-sponsored CEAs were associated with forty times greater odds of reporting a favorable CEA estimate2. To our knowledge, there has been no investigation on how well these CEA’s ICERs correlate with a back-of-the-envelope estimation for the cost per life year. As such, we systematically reviewed published CEAs of FDA-approved oncology drugs and evaluated these different models for correlation with our own back-of the- envelope calculations.
Aims: To estimate the cost per life year of FDA-approved oncology drugs and to correlate these ratios with the incremental cost-effectiveness ratios from published cost-effectiveness analysis models.
Methods:
We used a previously established comprehensive dataset that included of all oncology drugs that were FDA-approved for advanced, metastatic, or unresectable indication based on results from randomized controlled trials from 2015 through 2022. In this pilot study, we focused on oncology drugs approved in 2015. We selected for studies that reported an overall survival (OS) benefit, which resulted in a total of 14 drugs. We conducted a systematic search on Google Scholar for studies that calculated the cost-effectiveness of each drug, using the following query: [drug name] AND [trial name] AND [indication] AND "cost effectiveness”. In this analysis, we reviewed the first 10 search results, which is the standard number of articles that appears after entering a query into the Google Scholar search engine. To ensure standardization, we converted any studies reporting non-USD currencies to USD using the conversion rate index on one date.
This study used a back-of-the-envelope ICER calculation provided by The American Journal of Managed Care3 to determine the cost of the drug per life year. This ratio was expressed in a dollar/QALY figure, which was used as the standard comparator to the reported ICER in the published cost-effectiveness studies identified through our literature search. Drug costs were
1 1. Bell CM, Urbach DR, Ray JG, et al. Bias in published cost effectiveness studies: systematic review. BMJ. 2006;332(7543):699-703. doi:10.1136/bmj.38737.607558.80
2 Haslam A, Lythgoe MP, Greenstreet Akman E, Prasad V. Characteristics of Cost-effectiveness Studies for Oncology Drugs Approved in the United States From 2015-2020. JAMA Network Open. 2021;4(11):e2135123. doi:10.1001/jamanetworkopen.2021.35123
3 Pharmacoeconomics Refresher: The CVS $100K/QALY Announcement (Part 1). AJMC. Published October 9, 2018. Accessed March 15, 2023. https://www.ajmc.com/view/pharmacoeconomics-refresher-the-cvs-100kqaly-announcement-part-1
obtained using Micromedex® RED BOOK Online® average wholesale prices. For each drug we multiplied the price per month times the median progression free survival (PFS) of the pivotal trial to determine the total cost of the course of treatment. If the PFS was not available, the median duration of treatment was used. We then calculated the dollar per life year added i.e., if drug increased OS by three months for a cost of $150,000 per treatment course, then the cost per year was $600,000 per life year added.
Results
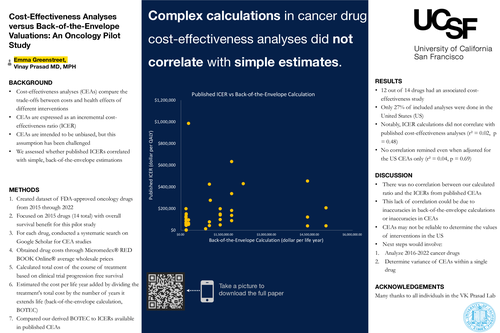
For the 14 cancer drugs approved in 2015, we reviewed 145 articles, of which 38 met the inclusion criteria. 12 out of 14 drugs had an associated cost-effectiveness study. 27% of included analyses were done in the United States. We found that the monthly drug costs were reported for 76% of the CEAs, and for the remaining analyses, such data was either not reported or could not be found. Notably, in our study, back-of-the-envelope ICER calculations did not correlate with published cost-effectiveness analyses (r² = 0.02, p = 0.48). This finding still held when only analyses done in the United States were included, (r² = 0.04, p = 0.69).
Discussion/Conclusion
In this study, we performed a back-of -the-envelope calculations to approximate the cost per life year of cancer drugs. For each respective cancer drug, we compared our calculated ratio with the ICERs from multiple published cost-effectiveness analysis models and found that these values lacked correlation. This lack of correlation could be due to inaccuracies in back-of-the-envelope calculations, or inaccuracies in CEAs, which would indicate that they cannot be relied on to determine the values of interventions in the US.
This study has limitations. Although drug costs were found through Micromedex® RED BOOK Online®, this public database does not provide the corresponding therapy administration cost or government discount rates. Thus, it is possible that our monthly drug cost underestimates the true cost to the healthcare system. Further, to maintain systematic replicability with the methods of a previous 2021 cross-sectional study examining CEAs in oncology, only the first ten search results for cost-effectiveness studies were used. As a result, it is possible that conclusions from all available studies were missed.
The next phase following this pilot study will be to continue this analysis for the remaining oncology drugs that were FDA-approved for advanced, metastatic, or unresectable indication based on results from randomized controlled trials from 2016 through 2022. In addition, for the CEAs that have reported monthly drug costs, we will use their cost in our cost per life year calculation and assess for correlation. We also believe it would be interesting to determine the degree of variance of CEAs within a single drug.