127 posters, 10 topics, 20 sessions, 127 authors
ePostersLive by SciGen Technologies S.A. All rights reserved.
UCSF 2024 Inquiry Symposium
Conference ePosters

P015
Using Vascular Deserts as a Guide for Limb Preservation Outreach Programs Successfully Targets Underserved Populations
Poster Presenter
Authors
Part of Topic
Clinical & Translational Sciences
Using Vascular Deserts as a Guide for Limb Preservation Outreach Programs Successfully Targets Underserved Populations
Vanessa Mora, Kathryn DiLosa, MD, MPH, Misty Humphries, MD, MAS, Teresa Daniele, MD, Leigh Ann O’Banion, MD
Objectives: Vascular deserts, defined as regions without vascular providers, were previously described as outreach targets for limb salvage efforts in chronic limb-threatening ischemia. CHAMPIONS programs (Comprehensive Heart and Multidisciplinary Limb Preservation Outreach Networks) bring care to patients. With desert maps as a guide, we targeted regions for outreach events and evaluated the population.
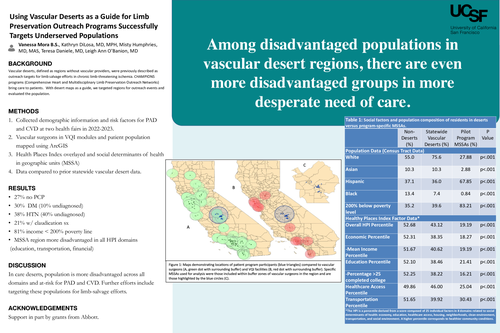
Methods: At two health fairs between 2022-2023, vascular surgeons and cardiologists screened and educated participants on peripheral arterial and cardiovascular disease (PACD). Demographics and cardiovascular risk factors were collected. Vascular surgeons and facilities participating in VQI modules were mapped with a 30-mile buffer using ArcGIS. Participants were mapped with census data, and the California Healthy Places Index overlayed for population and social determinants of health data analysis in associated Medical Service Study Areas (MSSA), a geographical analysis unit. (Figure 1) Results were compared to prior statewide desert data.
Results: Participants' mean age was 56 (range 6-88); 39% were male. 27% had no primary care provider. 30% of participants had diabetes by hemoglobin A1c, 10% were undiagnosed, 38% had hypertension, 40% were undiagnosed, and 21% described intermittent claudication. 81% of participants made less than $30,000 annually, putting them 200% or more below the poverty line, and 28% reported having no health insurance.
Patients in the pilot program MSSAs were more frequently Hispanic (68% vs. 36%, p<.001). Compared to other desert regions, the target population was more disadvantaged in all HPI domains, including economic (38 vs. 18%, p<.001), education (38 vs. 21%, p<.001), and transportation (40 vs. 30%, p<.001). (Table 1) Worse education, financial, and transportation resources correspond to decreased care access due to poor literacy and travel burdens.
Conclusions: Within care deserts, disadvantaged populations are in need of outreach. CHAMPIONS programs have successfully targeted populations needing care based on vascular desert maps, demonstrating that identifying at-risk populations can be successfully achieved. Further efforts should address health literacy, burdens of limited transportation, and financial resources by providing on-site screening for PACD.

|
Table 1: Social factors and population composition of residents in deserts versus program-specific MSSAs. |
||||
|
|
Non-Deserts (%) |
Statewide Vascular Deserts (%) |
Pilot Program MSSAs (%) |
P Value |
|
Population Data (Census Tract Data) |
||||
|
White |
55.0 |
75.6 |
27.88 |
p<.001 |
|
Asian |
10.3 |
10.3 |
2.88 |
p<.001 |
|
Hispanic |
37.1 |
36.0 |
67.85 |
p<.001 |
|
Black |
13.4 |
7.4 |
0.84 |
p<.001 |
|
200% below poverty level |
35.2 |
39.6 |
83.21 |
p<.001 |
|
Healthy Places Index Factor Data* |
||||
|
Overall HPI Percentile |
52.68 |
43.12 |
19.19 |
p<.001 |
|
Economic Percentile |
52.31 |
38.35 |
18.27 |
p<.001 |
|
-Mean Income Percentile |
51.67 |
40.62 |
19.19 |
p<.001 |
|
Education Percentile |
52.10 |
38.46 |
21.41 |
p<.001 |
|
-Percentage >25 completed college |
52.25 |
38.22 |
16.21 |
p<.001 |
|
Healthcare Access Percentile |
49.86 |
46.00 |
25.04 |
p<.001 |
|
Transportation Percentile |
51.65 |
39.92 |
30.43 |
p<.001 |
|
*The HPI is a percentile derived from a score composed of 25 individual factors in 8 domains related to social determinants of health: economy, education, healthcare access, housing, neighborhoods, clean environment, transportation, and social environment. A higher percentile corresponds to healthier community conditions. |
||||