127 posters, 10 topics, 20 sessions, 127 authors
ePostersLive by SciGen Technologies S.A. All rights reserved.
UCSF 2024 Inquiry Symposium
Conference ePosters

P009
Piloting Wearable Device Integration for Multiple Sclerosis Care and Decision-Making
Poster Presenter
Authors
Part of Topic
Clinical & Translational Sciences
Title: Piloting Wearable Device Integration for Multiple Sclerosis Care and Decision-Making
Introduction:
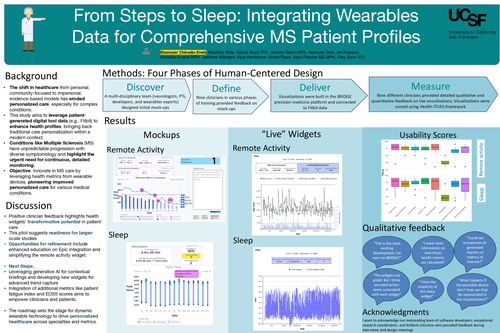
The shift from a personal, community-centered physician-patient relationship to a more impersonal, evidence-based model in healthcare has calloused patient care. In parallel, the proliferation of wearables for health monitoring allows for incorporating granular, patient-generated data into clinical decision-making. This study explores the potential of harnessing patient-generated data from one digital tool use case, Fitbit, to provide a more comprehensive health profile, aiming to replicate and augment aspects of traditional care's personalization within a modern medical framework. We start with multiple sclerosis (MS), a neurological condition characterized by unpredictable progression and diverse symptomatology that stands to significantly benefit from detailed, continuous health monitoring. By starting with MS, this project sets the stage for expanding the range of health metrics and wearable devices, ultimately aiming to enhance personalized care across various medical conditions.
Hypothesis:
Leveraging wearable technology via health widgets is a low-cost, high-value tool that helps clinicians better understand their patients' health profiles and promotes shared decision-making.
Aims:
The primary aim was to develop clinician-friendly health visualizations (“widgets”) that effectively integrate Fitbit data at the point of care. The secondary aim was to assess the individual widgets' perceived usability: clinical usefulness, feature set, functionality, ease of use, benefits, drawbacks, and integration into clinician workflow.
Project Design/Methods:
The wearables health widgets were developed using frameworks from human-centered design (HCD: discover, develop, deliver, measure) and evaluated using the Health Information Technology Usability Evaluation Scale (Health-ITUES) framework.
In the “Discover” phase, iterative discussions were held with UCSF design professionals, clinicians, engagement experts, physical therapists, and digital health researchers. This led to the creation of the widget mockups intended for integration into the UCSF BRIDGE precision medicine platform, which launches directly from the Epic electronic health record (EHR).
During the “Define” phase, nine R3-level and higher neurologists were interviewed one-on-one and completed a Likert scale survey to refine the widgets and the visualized metrics.
During the “deliver” phase, once prototyped and “live” in BRIDGE, the health widgets were improved iteratively based on feedback from nine outpatient neurologists specializing in neuro-inflammatory diseases, who were interviewed one-on-one and surveyed using a Likert scale.
The questions from the Likert scale survey were adapted from the Health-ITUES framework to measure usefulness, expected features, functionality, ease of use, benefits, drawbacks, integration, and recommendation likelihood.
Descriptive statistics, medians, and boxplots were used to evaluate health widgets. Additionally, nonparametric tests (Wilcoxon signed-rank tests) and Cohen's D assessed differences between remote activity and sleep widgets. Qualitative thematic analysis was also performed.
Results/Product:
The health widgets were developed over nine months (07/23 to 03/24). 18 clinicians were interviewed. The "define" round had nine clinicians (50% male, 40% female), seven early-career, and two middle-career clinicians. The "deliver" round had nine clinicians (50% male, 40% female), six early-careers, two middle-career, and one late-career.
From the “discover” phase, informed by the Fitbit domains measured and the team’s assessment of clinical utility from prior observational and epidemiological research, the four key metrics selected for point-of-care front-end visualization were heart rate, sleep, step count, and active minutes. Furthermore, an API was developed, and regulatory steps were taken on the back end to allow Fitbit data to be accessed and delivered into BRIDGE.
In the “define” phase, clinicians scored the initial mockups as quite usable. Median usability ratings (maximal score 9 for each) were: Usefulness (8), Desired Features (8), Functionality (8), Ease of Use (7), Clinical Benefit (8,) Clinical Drawbacks (2), Integration in Daily Routine (7), and Likelihood of Recommendation to a Colleague (8). Moreover, two visualizations were favored based on qualitative feedback: one for sleep and one for remote activity (step count and active minutes). The heart rate visualization was considered less useful.
In the “measure” phase, both widgets were rated highly. Median usability ratings for the sleep widget (maximal score 9 for each) were: Usefulness (8), Desired Features (7), Functionality (7), Ease of Use (8), Clinical Benefits (8), Drawbacks (2), Integration into Routine (7), Likelihood to Recommend to a Colleague (8). Median ratings for the remote activity widget were Usefulness (8.5), Desired Features (8), Functionality (7), Ease of Use (7), Clinical Benefits (8), Drawbacks (2), Integration into Routine (7), and Likelihood of Recommendation to a Colleague (8).
The "measure" phase feedback themes included admiration for sleep widgets' simplicity, desire for more visual simplicity in the remote activity widget, more patient-reported information for improved data contextualization, more explicit action steps for clinicians to take based on the patient’s data, and curiosity about the potential of generative AI reports.
Lastly, there were negligible differences in surveyed clinician perceptions, as Wilcoxon signed-rank tests on all surveyed elements yielded p-values of 0.5281, and Cohen’s D, indicating effect size, yielded 0.1211, 0.1211 (95% CI: -0.2087 to 0.4509).
Discussion/Conclusion:
Overall, the positive clinician feedback underscores the transformative potential of health widgets in patient care. In this small pilot, the clinicians' enthusiasm for the pilot and detailed feedback signal readiness for larger-scale studies to assess clinical validity. However, before such studies, opportunities for crucial refinements remain, such as increased socialization amongst patients, clinicians, and staff, of the tool’s integration with Epic and availability using one click. Furthermore, given the iterative nature of Human-centered design, ongoing refinement is necessary even after delivering widgets to the point of care. This is demonstrated by suggestions to simplify remote activity visualization.
Moreover, our roadmap for the next steps includes leveraging generative AI for contextual briefings, developing new widgets to capture and synthesize the 2nd-order and 3rd-order trends, and integrating additional metrics like the patient fatigue index and disability (EDSS) scores into existing widgets. These efforts aim to empower clinicians and patients with actionable insights while closing the gap between data acquisition and informed decision-making. Therefore, this sets the stage for dynamic wearable technology to drive personalized healthcare across medical specialties and health metrics.