477 posters, 14 topics, 2,052 authors, 1,056 institutions
ePostersLive by SciGen Technologies S.A. All rights reserved.
The Joint EBJIS-MSIS 2026 Conference
17 - 19 September, 2026 | Porto, Portugal
PP31
The Utility of the Minimum Biofilm Eradication Concentration (MBEC) for Predicting Prosthetic Joint Infection Treatment Outcome
Poster Presenter
Part of Topic
Microbiology
The Utility of the Minimum Biofilm Eradication Concentration
(MBEC) for Predicting Periprosthetic Joint Infection
Treatment Outcome
Paris E. Taylor, Elizabeth K. Stewart, Beethi Sinha, Matthew J. Dietz
West Virginia University School of Medicine · Department of Orthopaedics · Morgantown, WV, USA
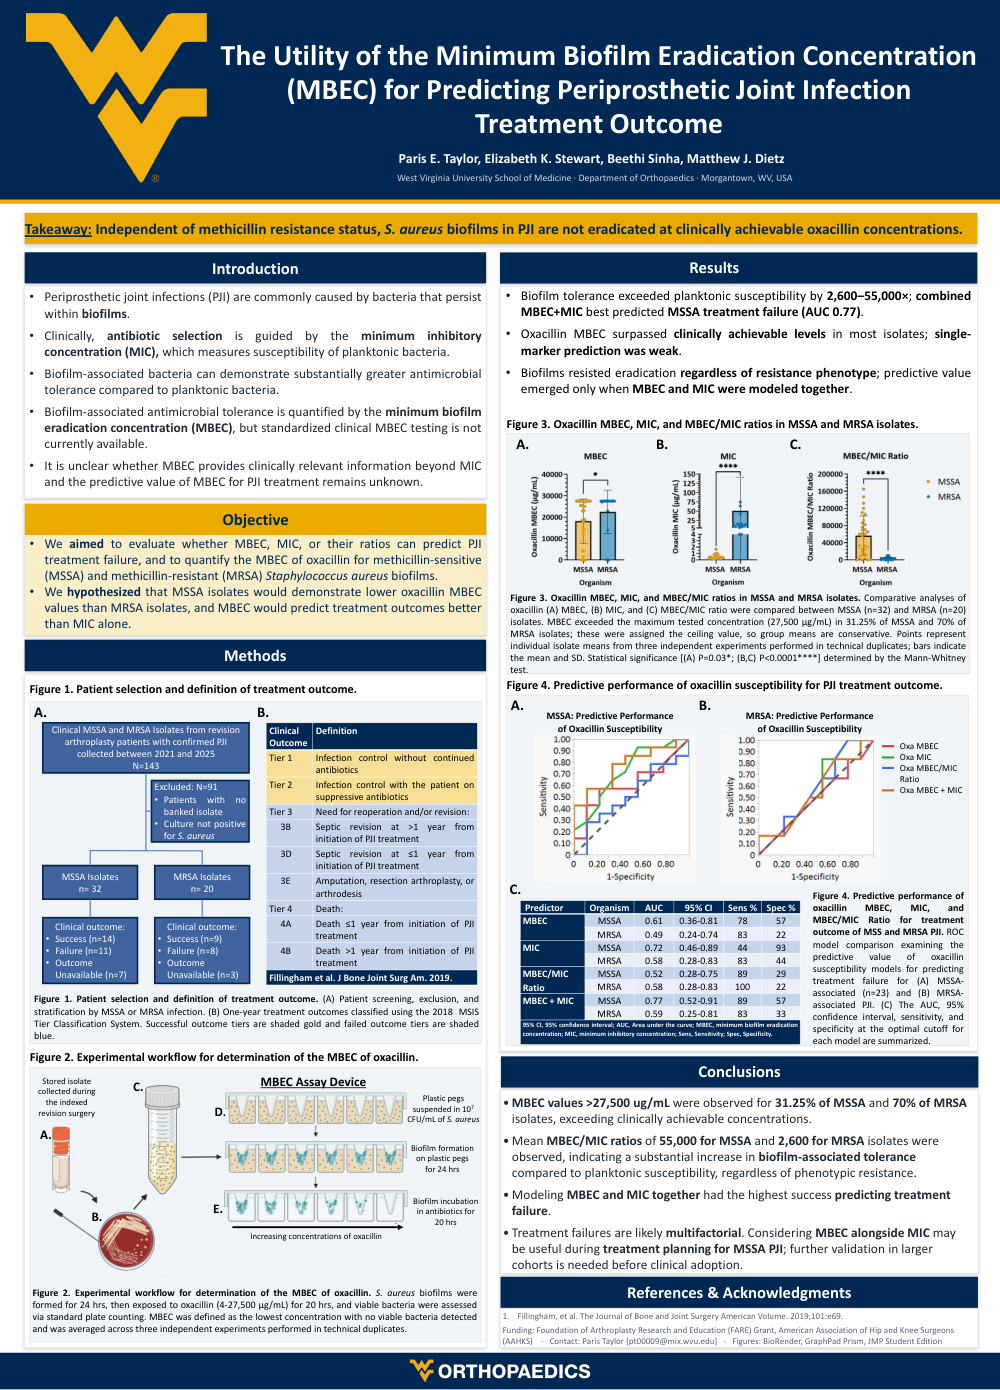
Takeaway: Independent of methicillin resistance status, S. aureus biofilms in PJI are not eradicated at clinically achievable oxacillin concentrations.
Introduction
- Periprosthetic joint infections (PJI) are commonly caused by bacteria that persist within biofilms.
- Clinically, antibiotic selection is guided by the minimum inhibitory concentration (MIC), which measures susceptibility of planktonic bacteria.
- Biofilm-associated bacteria can demonstrate substantially greater antimicrobial tolerance compared to planktonic bacteria.
- Biofilm-associated antimicrobial tolerance is quantified by the minimum biofilm eradication concentration (MBEC), but standardized clinical MBEC testing is not currently available.
- It is unclear whether MBEC provides clinically relevant information beyond MIC and the predictive value of MBEC for PJI treatment remains unknown.
- We aimed to evaluate whether MBEC, MIC, or their ratios can predict PJI treatment failure, and to quantify the MBEC of oxacillin for methicillin-sensitive (MSSA) and methicillin-resistant (MRSA) Staphylococcus aureus biofilms.
- We hypothesized that MSSA isolates would demonstrate lower oxacillin MBEC values than MRSA isolates, and MBEC would predict treatment outcomes better than MIC alone.
Objective
We aimed to evaluate whether MBEC, MIC, or their ratios can predict PJI treatment failure, and to quantify the MBEC of oxacillin for methicillin-sensitive (MSSA) and methicillin-resistant (MRSA) Staphylococcus aureus biofilms.
We hypothesized that MSSA isolates would demonstrate lower oxacillin MBEC values than MRSA isolates, and MBEC would predict treatment outcomes better than MIC alone.
Methods
Figure 1. Patient selection and definition of treatment outcome.
Patient selection:
- Clinical MSSA and MRSA isolates from revision arthroplasty patients with confirmed PJI collected between 2021 and 2025 (N=143).
- Excluded: N=91
- Patients with no banked isolate
- Culture not positive for S. aureus
- MSSA isolates: n=32
- Clinical outcome: Success (n=14)
- Clinical outcome: Failure (n=11)
- Outcome unavailable (n=7)
- MRSA isolates: n=20
- Clinical outcome: Success (n=9)
- Clinical outcome: Failure (n=8)
- Outcome unavailable (n=3)
Clinical outcome definition (2018 MSIS Tier Classification System):
|
Clinical Outcome |
Definition |
|
Tier 1 |
Infection control without continued antibiotics |
|
Tier 2 |
Infection control with the patient on suppressive antibiotics |
|
Tier 3 |
Need for reoperation and/or revision |
|
3B |
Septic revision at >1 year from initiation of PJI treatment |
|
3D |
Septic revision at ≤1 year from initiation of PJI treatment |
|
3E |
Amputation, resection arthroplasty, or arthrodesis |
|
Tier 4 |
Death |
|
4A |
Death ≤1 year from initiation of PJI treatment |
|
4B |
Death >1 year from initiation of PJI treatment |
Figure 1 caption: Patient selection and definition of treatment outcome. (A) Patient screening, exclusion, and stratification by MSSA or MRSA infection. (B) One-year treatment outcomes classified using the 2018 MSIS Tier Classification System. Successful outcome tiers are shaded gold and failed outcome tiers are shaded blue.
Citation shown in poster: Fillingham et al. J Bone Joint Surg Am. 2019.
Figure 2. Experimental workflow for determination of the MBEC of oxacillin.
Oxacillin concentrations tested: 4-27,500 µg/mL
A. Stored isolate collected during the indexed revision surgery
B. Isolate streaked on agar
C. Bacterial suspension prepared
D. MBEC assay device: plastic pegs suspended in 10⁷ CFU/mL of S. aureus; biofilm formation on plastic pegs for 24 hrs
E. Biofilm incubation in antibiotics for 20 hrs across increasing concentrations of oxacillin
Figure 2 caption: Experimental workflow for determination of the MBEC of oxacillin. S. aureus biofilms were formed for 24 hrs, then exposed to oxacillin (4-27,500 µg/mL) for 20 hrs, and viable bacteria were assessed via standard plate counting. MBEC was defined as the lowest concentration with no viable bacteria detected and was averaged across three independent experiments performed in technical duplicates.
Results
- Biofilm tolerance exceeded planktonic susceptibility by 2,600-55,000×; combined MBEC+MIC best predicted MSSA treatment failure (AUC 0.77).
- Oxacillin MBEC surpassed clinically achievable levels in most isolates; single-marker prediction was weak.
- Biofilms resisted eradication regardless of resistance phenotype; predictive value emerged only when MBEC and MIC were modeled together.
Figure 3. Oxacillin MBEC, MIC, and MBEC/MIC ratios in MSSA and MRSA isolates.
Figure 3 caption: Oxacillin MBEC, MIC, and MBEC/MIC ratios in MSSA and MRSA isolates. Comparative analyses of oxacillin (A) MBEC, (B) MIC, and (C) MBEC/MIC ratio were compared between MSSA (n=32) and MRSA (n=20) isolates. MBEC exceeded the maximum tested concentration (27,500 µg/mL) in 31.25% of MSSA and 70% of MRSA isolates; these were assigned the ceiling value, so group means are conservative. Points represent individual isolate means from three independent experiments performed in technical duplicates; bars indicate the mean and SD. Statistical significance [(A) P=0.03*; (B,C) P<0.0001****] determined by the Mann-Whitney test.
Figure 4. Predictive performance of oxacillin susceptibility for PJI treatment outcome.
Figure 4 caption: Predictive performance of oxacillin MBEC, MIC, and MBEC/MIC ratio for treatment outcome of MSSA and MRSA PJI. ROC model comparison examining the predictive value of oxacillin susceptibility models for predicting treatment failure for (A) MSSA-associated (n=23) and (B) MRSA-associated PJI. (C) The AUC, 95% confidence interval, sensitivity, and specificity at the optimal cutoff for each model are summarized.
|
Predictor |
Organism |
AUC |
95% CI |
Sens % |
Spec % |
|
MBEC |
MSSA |
0.61 |
0.36-0.81 |
78 |
57 |
|
MBEC |
MRSA |
0.49 |
0.24-0.74 |
83 |
22 |
|
MIC |
MSSA |
0.72 |
0.46-0.89 |
44 |
93 |
|
MIC |
MRSA |
0.58 |
0.28-0.83 |
83 |
44 |
|
MBEC/MIC Ratio |
MSSA |
0.52 |
0.28-0.75 |
89 |
29 |
|
MBEC/MIC Ratio |
MRSA |
0.58 |
0.28-0.83 |
100 |
22 |
|
MBEC + MIC |
MSSA |
0.77 |
0.52-0.91 |
89 |
57 |
|
MBEC + MIC |
MRSA |
0.59 |
0.25-0.81 |
83 |
33 |
Abbreviations: 95% CI, 95% confidence interval; AUC, area under the curve; MBEC, minimum biofilm eradication concentration; MIC, minimum inhibitory concentration; Sens, sensitivity; Spec, specificity.
Conclusions
- MBEC values >27,500 µg/mL were observed for 31.25% of MSSA and 70% of MRSA isolates, exceeding clinically achievable concentrations.
- Mean MBEC/MIC ratios of 55,000 for MSSA and 2,600 for MRSA isolates were observed, indicating a substantial increase in biofilm-associated tolerance compared to planktonic susceptibility, regardless of phenotypic resistance.
- Modeling MBEC and MIC together had the highest success predicting treatment failure.
- Treatment failures are likely multifactorial. Considering MBEC alongside MIC may be useful during treatment planning for MSSA PJI; further validation in larger cohorts is needed before clinical adoption.
References & Acknowledgments
1. Fillingham, et al. The Journal of Bone and Joint Surgery American Volume. 2019;101:e69.
Funding: Foundation of Arthroplasty Research and Education (FARE) Grant, American Association of Hip and Knee Surgeons (AAHKS)
Contact: Paris Taylor [pt00009@mix.wvu.edu]
Figures: BioRender, GraphPad Prism, JMP Student Edition