875 posters, 25 topics, 3,440 authors, 1,061 institutions
ePostersLive by SciGen Technologies S.A. All rights reserved.
SAGES 2026 Annual Meeting Emerging Technology Session
March 25-28, 2026 | Tampa, FL, USA

P188
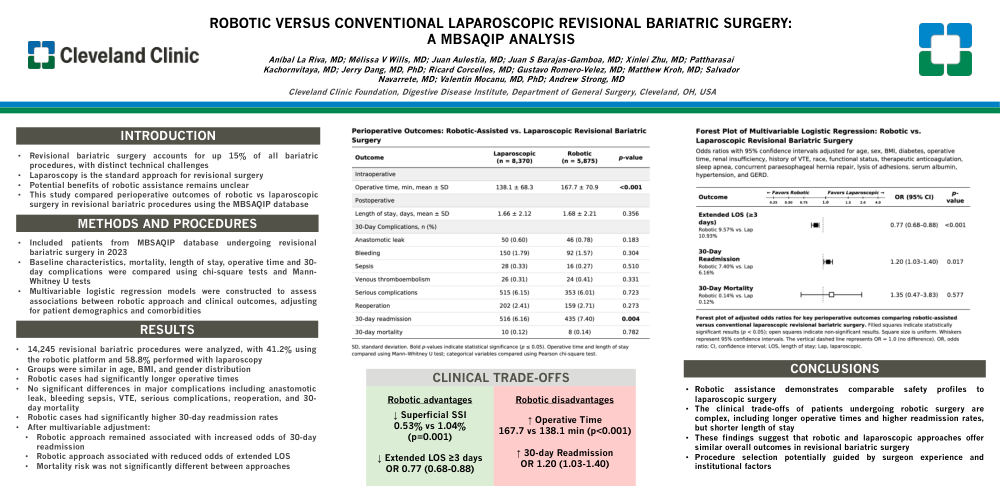
ROBOTIC VERSUS CONVENTIONAL LAPAROSCOPIC REVISIONAL BARIATRIC SURGERY: AN MBSAQIP ANALYSIS
Poster Presenter
Part of Topic
Bariatric
ROBOTIC VERSUS CONVENTIONAL LAPAROSCOPIC REVISIONAL BARIATRIC SURGERY: A MBSAQIP ANALYSIS
Aníbal La Riva, MD; Mélissa V Wills, MD; Juan Aulestia, MD; Juan S Barajas-Gamboa, MD; Xinlei Zhu, MD; Pattharasai Kachornvitaya, MD; Jerry Dang, MD, PhD; Ricard Corcelles, MD; Gustavo Romero-Velez, MD; Matthew Kroh, MD; Salvador Navarrete, MD; Valentin Mocanu, MD, PhD; Andrew Strong, MD
Cleveland Clinic Foundation, Digestive Disease Institute, Department of General Surgery, Cleveland, OH, USA
INTRODUCTION
- Revisional bariatric surgery accounts for up 15% of all bariatric procedures, with distinct technical challenges
- Laparoscopy is the standard approach for revisional surgery
- Potential benefits of robotic assistance remains unclear
- This study compared perioperative outcomes of robotic vs laparoscopic surgery in revisional bariatric procedures using the MBSAQIP database
METHODS AND PROCEDURES
- Included patients from MBSAQIP database undergoing revisional bariatric surgery in 2023
- Baseline characteristics, mortality, length of stay, operative time and 30-day complications were compared using chi-square tests and Mann-Whitney U tests
- Multivariable logistic regression models were constructed to assess associations between robotic approach and clinical outcomes, adjusting for patient demographics and comorbidities
RESULTS
- 14,245 revisional bariatric procedures were analyzed, with 41.2% using the robotic platform and 58.8% performed with laparoscopy
- Groups were similar in age, BMI, and gender distribution
- Robotic cases had significantly longer operative times
- No significant differences in major complications including anastomotic leak, bleeding sepsis, VTE, serious complications, reoperation, and 30-day mortality
- Robotic cases had significantly higher 30-day readmission rates
- After multivariable adjustment:
- Robotic approach remained associated with increased odds of 30-day readmission
- Robotic approach associated with reduced odds of extended LOS
- Mortality risk was not significantly different between approaches
Perioperative Outcomes: Robotic-Assisted vs. Laparoscopic Revisional Bariatric Surgery
| Outcome | Laparoscopic (n = 8,370) | Robotic (n = 5,875) | p-value |
|---|---|---|---|
| Intraoperative | |||
| Operative time, min, mean ± SD | 138.1 ± 68.3 | 167.7 ± 70.9 | <0.001 |
| Postoperative | |||
| Length of stay, days, mean ± SD | 1.66 ± 2.12 | 1.68 ± 2.21 | 0.356 |
| 30-Day Complications, n (%) | |||
| Anastomotic leak | 50 (0.60) | 46 (0.78) | 0.183 |
| Bleeding | 150 (1.79) | 92 (1.57) | 0.304 |
| Sepsis | 28 (0.33) | 16 (0.27) | 0.510 |
| Venous thromboembolism | 26 (0.31) | 24 (0.41) | 0.331 |
| Serious complications | 515 (6.15) | 353 (6.01) | 0.723 |
| Reoperation | 202 (2.41) | 159 (2.71) | 0.273 |
| 30-day readmission | 516 (6.16) | 435 (7.40) | 0.004 |
| 30-day mortality | 10 (0.12) | 8 (0.14) | 0.782 |
SD, standard deviation. Bold p-values indicate statistical significance (p ≤ 0.05). Operative time and length of stay compared using Mann-Whitney U test; categorical variables compared using Pearson chi-square test.
CLINICAL TRADE-OFFS
Robotic advantages
- ↓ Superficial SSI: 0.53% vs 1.04% (p=0.001)
- ↓ Extended LOS ≥3 days: OR 0.77 (0.68–0.88)
Robotic disadvantages
- ↑ Operative Time: 167.7 vs 138.1 min (p<0.001)
- ↑ 30-day Readmission: OR 1.20 (1.03–1.40)
Forest Plot of Multivariable Logistic Regression: Robotic vs. Laparoscopic Revisional Bariatric Surgery
Odds ratios with 95% confidence intervals adjusted for age, sex, BMI, diabetes, operative time, renal insufficiency, history of VTE, race, functional status, therapeutic anticoagulation, sleep apnea, concurrent paraesophageal hernia repair, lysis of adhesions, serum albumin, hypertension, and GERD.
| Outcome | OR (95% CI) | p-value |
|---|---|---|
| Extended LOS (≥3 days): Robotic 9.57% vs. Lap 10.93% | 0.77 (0.68–0.88) | <0.001 |
| 30-Day Readmission: Robotic 7.40% vs. Lap 6.16% | 1.20 (1.03–1.40) | 0.017 |
| 30-Day Mortality: Robotic 0.14% vs. Lap 0.12% | 1.35 (0.47–3.83) | 0.577 |
Forest plot of adjusted odds ratios for key perioperative outcomes comparing robotic-assisted versus conventional laparoscopic revisional bariatric surgery. Filled squares indicate statistically significant results (p < 0.05); open squares indicate non-significant results. Square size is uniform. Whiskers represent 95% confidence intervals. The vertical dashed line represents OR = 1.0 (no difference). OR, odds ratio; CI, confidence interval; LOS, length of stay; Lap, laparoscopic.
CONCLUSIONS
- Robotic assistance demonstrates comparable safety profiles to laparoscopic surgery
- The clinical trade-offs of patients undergoing robotic surgery are complex, including longer operative times and higher readmission rates, but shorter length of stay
- These findings suggest that robotic and laparoscopic approaches offer similar overall outcomes in revisional bariatric surgery
- Procedure selection potentially guided by surgeon experience and institutional factors