119 posters, 6 topics, 524 authors, 243 institutions
ePostersLive by SciGen Technologies S.A. All rights reserved.
RCR Global AI Conference 2026
29-30 June, 2026 | QEII Centre, Westminster

227
Improving Breast Mass Classification using Control-Driven Data Augmentation
Part of Topic
AI Education and research: examples of proof of concept or AI in development, technical advances, teaching approaches or pre-clinical testing
INTRODUCTION
Overall vision:
To develop a breast-mass AI inspector that provides radiologists with relevant information when they select or outline a breast mass on a mammographic image.
Dataset and classification task:
Our dataset is formed by mammographic images selected from the OPTIMAM imaging database (OMBI-DB) (for access see [1] and for database description see [2]). A subset of images in OMI-DB contains professionally marked lesions, with bounding box coordinates, providing a ground-truth labelled dataset.
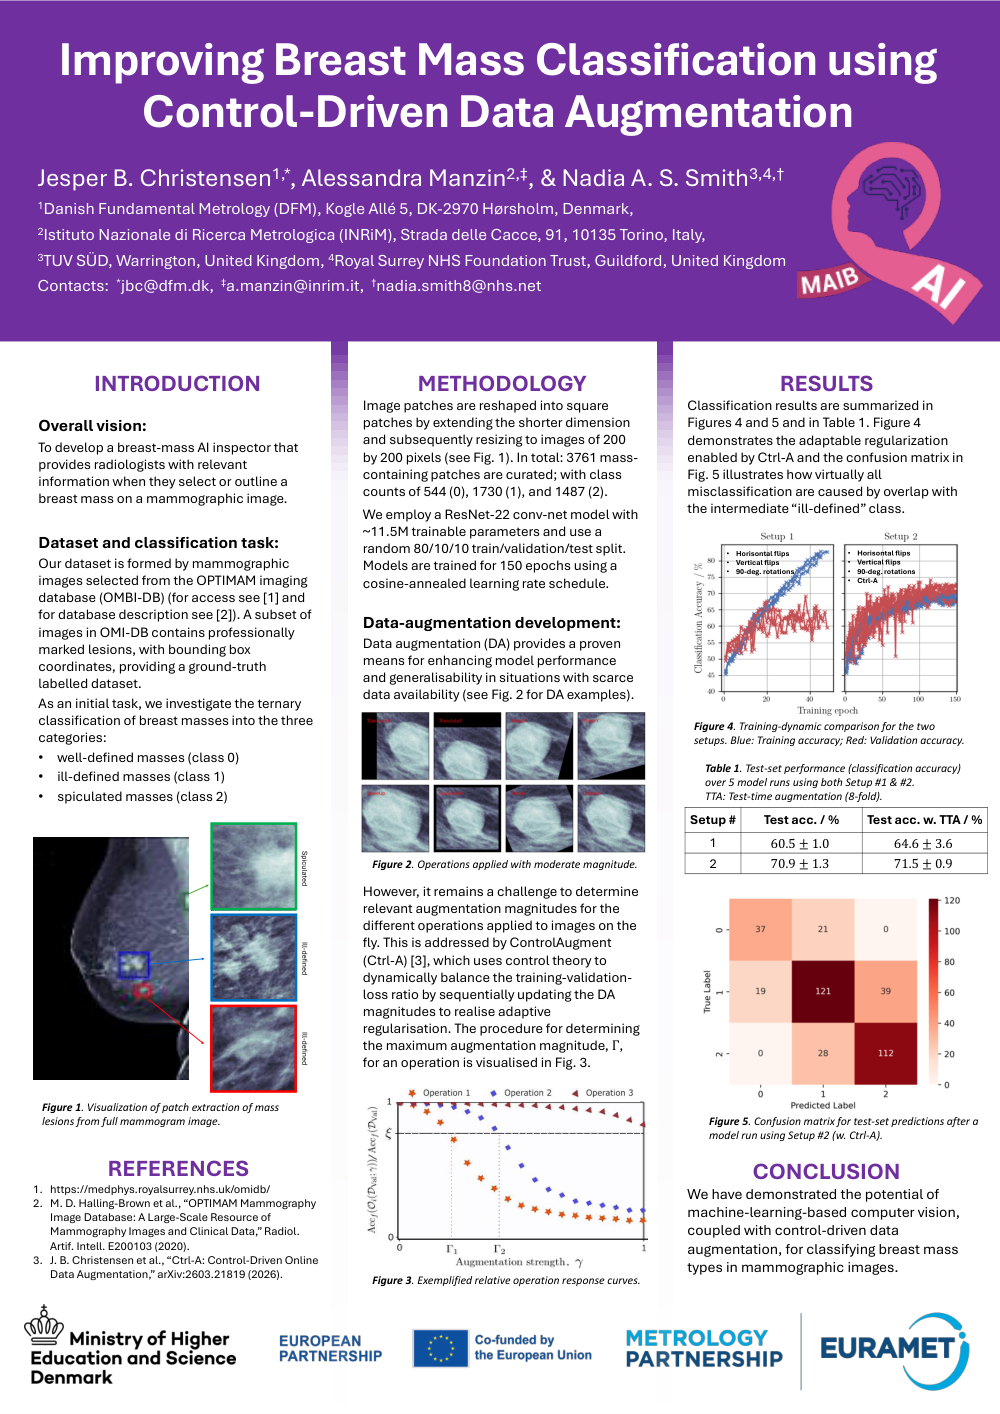
As an initial task, we investigate the ternary classification of breast masses into the three categories:
METHODOLOGY
Image patches are reshaped into square patches by extending the shorter dimension and subsequently resizing to images of 200 by 200 pixels (see Fig. 1). In total: 3761 mass-containing patches are curated; with class counts of 544 (0), 1730 (1), and 1487 (2).
We employ a ResNet-22 conv-net model with ~11.5M trainable parameters and use a random 80/10/10 train/validation/test split. Models are trained for 150 epochs using a cosine-annealed learning rate schedule.
Data-augmentation development:
Data augmentation (DA) provides a proven means for enhancing model performance and generalisability in situations with scarce data availability (see Fig. 2 for DA examples).However, it remains a challenge to determine relevant augmentation magnitudes for the different operations applied to images on the fly. This is addressed by ControlAugment (Ctrl-A) [3], which uses control theory to dynamically balance the training-validation-loss ratio by sequentially updating the DA magnitudes to realise adaptive regularisation. The procedure for determining the maximum augmentation magnitude, Γ, for an operation is visualised in Fig. 3.
RESULTS
Classification results are summarized in Figures 4 and 5 and in Table 1. Figure 4 demonstrates the adaptable regularization enabled by Ctrl-A and the confusion matrix in Fig. 5 illustrates how virtually all misclassification are caused by overlap with the intermediate “ill-defined” class.
CONCLUSION
We have demonstrated the potential of machine-learning-based computer vision, coupled with control-driven data augmentation, for classifying breast mass types in mammographic images.
REFERENCES