586 posters, 8 topics, 23 sessions, 1,077 authors, 622 institutions
ePostersLive by SciGen Technologies S.A. All rights reserved.
ISQua's 40th International Conference 2024
24th - 27th September 2024 | Istanbul, Türkiye

P281
Characteristics of risk-adjusted length of hospital stay for pneumonia based on administrative claim data in Japan
Poster Presenter
Authors
Affiliations
Part of Topic
Patient Safety & Quality Improvement
Characteristics of risk-adjusted length of hospital stay for pneumonia based on administrative claim data in Japan
Introduction
Long-term hospitalization places an increased burden on both patients and society.
Length of hospital stay (LOS) could be influenced by patient characteristics and quality of hospital care.
The following procedures were required to analyze the relative quality of care;
- Risk-adjustment (Standardization) of patient characteristics
- Use of quality indicators
Aim
1. To develop the standardized indicator to measure the quality of LOS management.
2. To reveal the characteristics of new risk-adjusted quality indicator for LOS management (1).
Methods
Study design
Retrospective observational study using the Japanese medical claim data from 2014 to 2022.
Definition
Prolonged hospitalization (PH): LOS exceeding the average duration of pneumonia in Japan.
Pneumonia: A370, A378, A379, A481, B012, B052, B371, B59, J13-18 in ICD-10.
Analysis overview
This study had 3 steps for analysis.
1. Patients level data were risk-adjusted with the frequency of occurrence of PH using logistic regression analysis.
- Risk-adjustment variables:
sex, emergency admission, Charlson comorbidity index (CCI) score, A-DRPOP score*, and Barthel index score.
* The A-DROP score was developed by the Japanese Respiratory Society. It is a modified version of the CURB-65 scoring system.
Two risk-adjusted models were conducted:
- A model using data from the entire period (2014-2022)
- Models using data from each specific period (2014-2016, 2017-2019, 2020-2022)
2. The expected number of PH patients was aggregated of (1) in each hospital.
- The risk-adjusted PH (RPH) ratio each hospital was expressed by the following formula;
RPH ratio=((Observed number of PH patients)/(Expected number of PH patients)) ×100
3. The characteristics (trends) of RPH ratio in each hospital were calculated by Spearman’s correlation coefficient.
Results
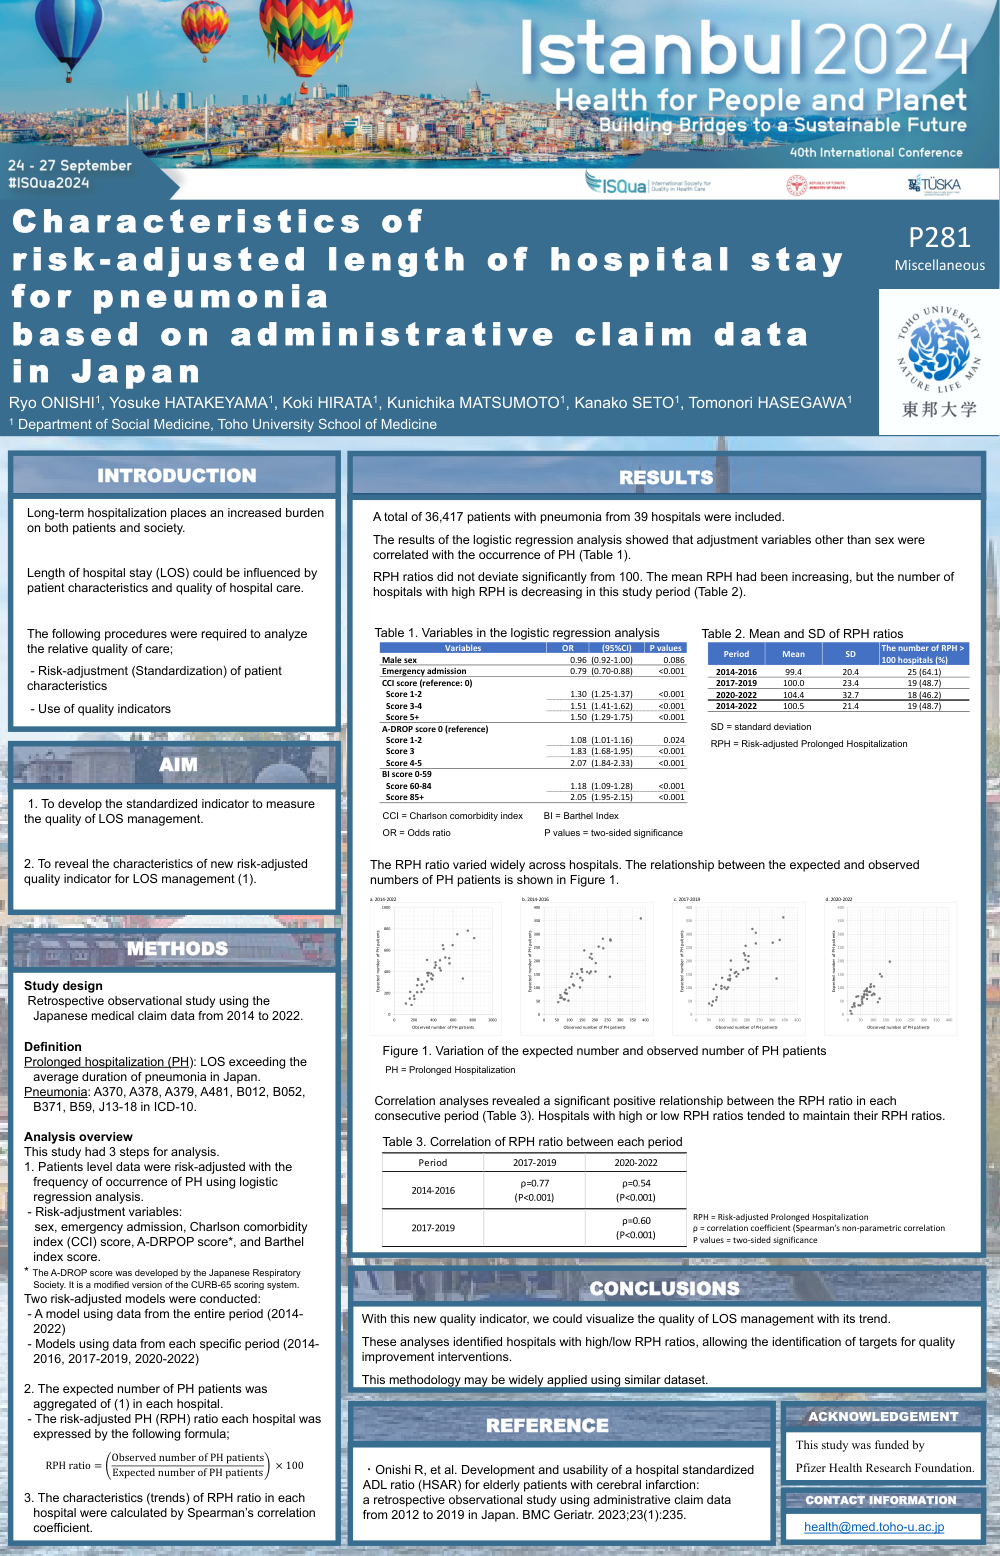
A total of 36,417 patients with pneumonia from 39 hospitals were included.
The results of the logistic regression analysis showed that adjustment variables other than sex were correlated with the occurrence of PH (Table 1).
RPH ratios did not deviate significantly from 100. The mean RPH had been increasing, but the number of hospitals with high RPH is decreasing in this study period (Table 2).
The RPH ratio varied widely across hospitals. The relationship between the expected and observed numbers of PH patients is shown in Figure 1.
Correlation analyses revealed a significant positive relationship between the RPH ratio in each consecutive period (Table 3). Hospitals with high or low RPH ratios tended to maintain their RPH ratios.
Conclusions
With this new quality indicator, we could visualize the quality of LOS management with its trend.
These analyses identified hospitals with high/low RPH ratios, allowing the identification of targets for quality improvement interventions.
This methodology may be widely applied using similar dataset.
Reference
Onishi R, et al. Development and usability of a hospital standardized ADL ratio (HSAR) for elderly patients with cerebral infarction: a retrospective observational study using administrative claim data from 2012 to 2019 in Japan. BMC Geriatr. 2023;23(1):235.
Acknowledgement
This study was funded by Pfizer Health Research Foundation.
Contact information