4,068 posters, 219 videos, 101 topics, 69 sessions, 14,365 authors, 6,128 institutions
ePostersLive by SciGen Technologies S.A. All rights reserved.
Alzheimer's Association International Conference 2026
July 12-15, 2026 | London, United Kingdom, and Online

13785
Proteomics Signature Of Whole-brain Microstructural Integrity Of White Matter Using Latentsna
Poster Presenter
Authors
Part of Topic
Virtual
Proteomics signature of whole-brain microstructural integrity of white matter using LatentSNA
Ash Sharma, MS; Connor Lee Cornelison, MS; Luling Alton, MS; Krishnendu Chandra, PhD; Qiuting Wen, PhD; Kwangsik Nho, PhD; Andrew J. Saykin, PhD; Yu-Chien Wu, PhD; and Selena Wang, PhD, Department of Biostatistics and Health Data Science; Department of Radiology and Imaging Sciences; and Indiana Alzheimer’s Disease Research Center, Indiana University School of Medicine, Indianapolis, IN, USA.
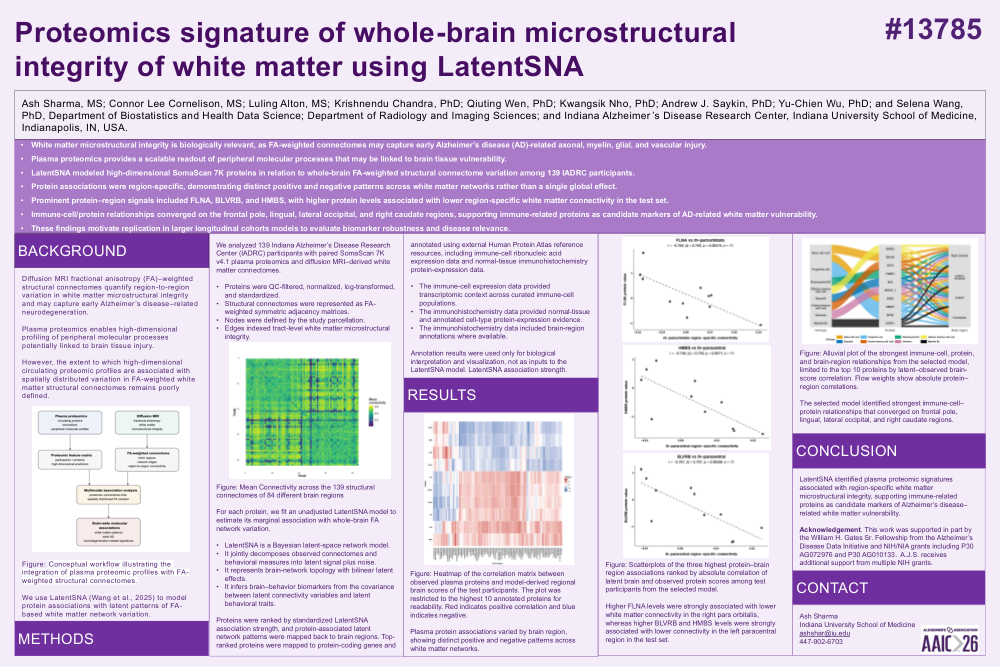
• White matter microstructural integrity is biologically relevant, as FA-weighted connectomes may capture early Alzheimer’s disease (AD)-related axonal, myelin, glial, and vascular injury.
• Plasma proteomics provides a scalable readout of peripheral molecular processes that may be linked to brain tissue vulnerability.
• LatentSNA modeled high-dimensional SomaScan 7K proteins in relation to whole-brain FA-weighted structural connectome variation among 139 IADRC participants.
• Protein associations were region-specific, demonstrating distinct positive and negative patterns across white matter networks rather than a single global effect.
• Prominent protein–region signals included FLNA, BLVRB, and HMBS, with higher protein levels associated with lower region-specific white matter connectivity in the test set.
• Immune-cell/protein relationships converged on the frontal pole, lingual, lateral occipital, and right caudate regions, supporting immune-related proteins as candidate markers of AD-related white matter vulnerability.
• These findings motivate replication in larger longitudinal cohorts models to evaluate biomarker robustness and disease relevance.
BACKGROUND
Diffusion MRI fractional anisotropy (FA)–weighted structural connectomes quantify region-to-region variation in white matter microstructural integrity and may capture early Alzheimer’s disease–related neurodegeneration.
Plasma proteomics enables high-dimensional profiling of peripheral molecular processes potentially linked to brain tissue injury.
However, the extent to which high-dimensional circulating proteomic profiles are associated with spatially distributed variation in FA-weighted white matter structural connectomes remains poorly defined.
Figure text: Conceptual workflow
• Plasma proteomics
circulating proteins
biomarkers
peripheral molecular profiles
• Diffusion MRI
fractional anisotropy
white matter
microstructural integrity
• Proteomic feature matrix
participants × proteins
high-dimensional predictors
• FA-weighted connectome
brain regions
network edges
region-to-region connectivity
• Multimodal association analysis
proteome–connectome links
spatially distributed FA variation
• Brain-wide molecular associations
white matter patterns
early AD
neurodegeneration-related signatures
Figure: Conceptual workflow illustrating the integration of plasma proteomic profiles with FA-weighted structural connectomes.
We use LatentSNA (Wang et al., 2025) to model protein associations with latent patterns of FA-based white matter network variation.
METHODS
We analyzed 139 Indiana Alzheimer’s Disease Research Center (IADRC) participants with paired SomaScan 7K v4.1 plasma proteomics and diffusion MRI–derived white matter connectomes.
• Proteins were QC-filtered, normalized, log-transformed, and standardized.
• Structural connectomes were represented as FA-weighted symmetric adjacency matrices.
• Nodes were defined by the study parcellation.
• Edges indexed tract-level white matter microstructural integrity.
Figure text: Mean connectivity heatmap
• Axes: Node, Node
• Tick labels: 0, 20, 40, 60, 80
• Color scale: Mean connectivity; 0.6, 0.4, 0.2
Figure: Mean Connectivity across the 139 structural connectomes of 84 different brain regions
For each protein, we fit an unadjusted LatentSNA model to estimate its marginal association with whole-brain FA network variation.
• LatentSNA is a Bayesian latent-space network model.
• It jointly decomposes observed connectomes and behavioral measures into latent signal plus noise.
• It represents brain-network topology with bilinear latent effects.
• It infers brain–behavior biomarkers from the covariance between latent connectivity variables and latent behavioral traits.
Proteins were ranked by standardized LatentSNA association strength, and protein-associated latent network patterns were mapped back to brain regions. Top-ranked proteins were mapped to protein-coding genes and annotated using external Human Protein Atlas reference resources, including immune-cell ribonucleic acid expression data and normal-tissue immunohistochemistry protein-expression data.
• The immune-cell expression data provided transcriptomic context across curated immune-cell populations.
• The immunohistochemistry data provided normal-tissue and annotated cell-type protein-expression evidence.
• The immunohistochemistry data included brain-region annotations where available.
Annotation results were used only for biological interpretation and visualization, not as inputs to the LatentSNA model. LatentSNA association strength.
RESULTS
Figure text: Heatmap
• Y-axis: Protein
• X-axis: Brain Region
• Protein labels: BLVRB, HMBS, APOH, YWHAH, CCT8, CAPNS1, PDGFB, VCP, FCN2, GMPR
• Color scale: Pearson r; 1.0, 0.5, 0.0, −0.5, −1.0
Figure: Heatmap of the correlation matrix between observed plasma proteins and model-derived regional brain scores of the test participants. The plot was restricted to the highest 10 annotated proteins for readability. Red indicates positive correlation and blue indicates negative.
Plasma protein associations varied by brain region, showing distinct positive and negative patterns across white matter networks.
Figure text: Scatterplot 1
• Title: FLNA vs rh–parsorbitalis
• r = −0.768; |r| = 0.768; p = 0.00574; n = 11
• Y-axis: FLNA protein value
• X-axis: rh–parsorbitalis region–specific connectivity
Figure text: Scatterplot 2
• Title: HMBS vs lh–paracentral
• r = −0.756; |r| = 0.756; p = 0.0071; n = 11
• Y-axis: HMBS protein value
• X-axis: lh–paracentral region–specific connectivity
Figure text: Scatterplot 3
• Title: BLVRB vs lh–paracentral
• r = −0.767; |r| = 0.767; p = 0.00586; n = 11
• Y-axis: BLVRB protein value
• X-axis: lh–paracentral region–specific connectivity
Figure: Scatterplots of the three highest protein–brain region associations ranked by absolute correlation of latent brain and observed protein scores among test participants from the selected model.
Higher FLNA levels were strongly associated with lower white matter connectivity in the right pars orbitalis, whereas higher BLVRB and HMBS levels were strongly associated with lower connectivity in the left paracentral region in the test set.
Figure text: Alluvial plot
• Cell type
Naive cd8 t-cell
Progenitor cell
Plasmacytoid DC
Effector memory cd8 t-cell
Basophil
Central memory cd8 t-cell
Unknown
Myeloid DC
• Protein
HARS1
EIF4A2
AKT3
FKBP3
BTK
ANXA7_1
DDX6
ANXA7
EIF4E
AGFG1
• Brain region
Right Caudate
Lateral Occipital
Lingual
Frontalpole
• Legend title: Cell type
• Legend labels: Naive cd8 t-cell; Progenitor cell; Plasmacytoid DC; Effector memory cd8 t-cell; Basophil; Central memory cd8 t-cell; Unknown; Myeloid DC
Figure: Alluvial plot of the strongest immune-cell, protein, and brain-region relationships from the selected model, limited to the top 10 proteins by latent–observed brain-score correlation. Flow weights show absolute protein–region correlations.
The selected model identified strongest immune-cell–protein relationships that converged on frontal pole, lingual, lateral occipital, and right caudate regions.
CONCLUSION
LatentSNA identified plasma proteomic signatures associated with region-specific white matter microstructural integrity, supporting immune-related proteins as candidate markers of Alzheimer’s disease–related white matter vulnerability.
Acknowledgement. This work was supported in part by the William H. Gates Sr. Fellowship from the Alzheimer’s Disease Data Initiative and NIH/NIA grants including P30 AG072976 and P30 AG010133. A.J.S. receives additional support from multiple NIH grants.
CONTACT
Ash Sharma
Indiana University School of Medicine
ashshar@iu.edu
447-902-6703
Comments
Email is required but is not shown publicly.
Loading comments...