1,267 posters, 47 videos, 13 topics, 4 sessions, 853 authors
ePostersLive by SciGen Technologies S.A. All rights reserved.
SOHO 2026 Annual Meeting
September 9 - 12, 2026 | George R. Brown Convention Center, Houston, Texas

CT - 1327
State-Resolved Regulatory Profiling Identifies Product-Specific Transcription Factor and Pathway Activity in Axi-Cel and Tisa-Cel Infusion Products
Poster Presenter
Authors
Part of Topic
Cellular Therapy (CT)
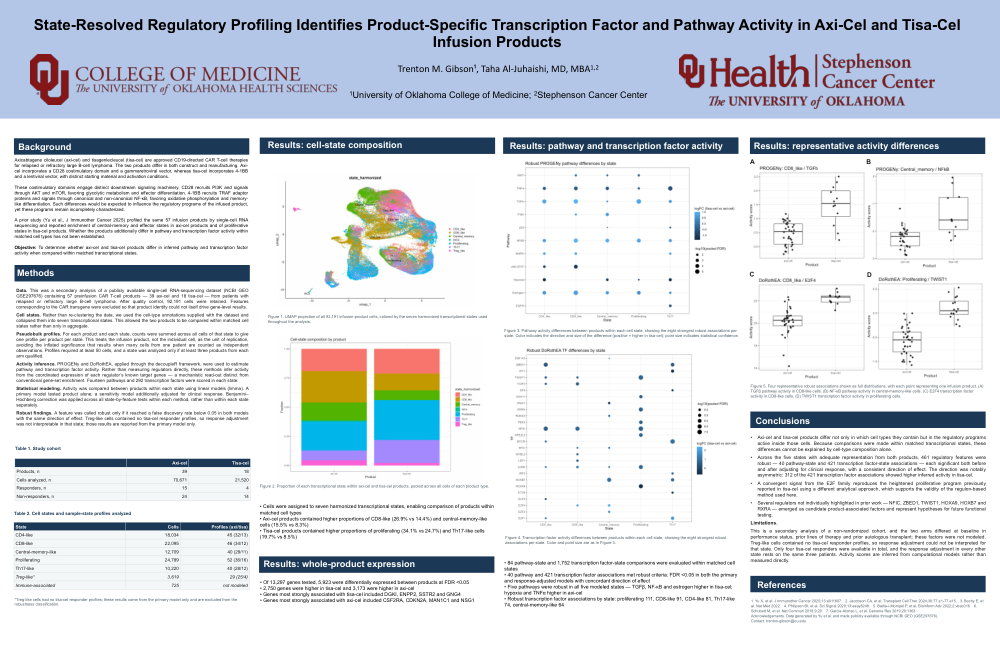
State-Resolved Regulatory Profiling Identifies Product-Specific Transcription Factor and Pathway Activity in Axi-Cel and Tisa-Cel Infusion Products Trenton M. Gibson¹, Taha Al-Juhaishi, MD, MBA 1,2 1University of Oklahoma College of Medicine; 2Stephenson Cancer Center Background Axicabtagene ciloleucel (axi-cel) and tisagenlecleucel (tisa-cel) are approved CD19-directed CAR T-cell therapies for relapsed or refractory large B-cell lymphoma. The two products differ in both construct and manufacturing. Axicel incorporates a CD28 costimulatory domain and a gammaretroviral vector, whereas tisa-cel incorporates 4-1BB and a lentiviral vector, with distinct starting material and activation conditions. These costimulatory domains engage distinct downstream signaling machinery. CD28 recruits PI3K and signals through AKT and mTOR, favoring glycolytic metabolism and effector differentiation. 4-1BB recruits TRAF adaptor proteins and signals through canonical and non-canonical NF-κB, favoring oxidative phosphorylation and memorylike differentiation. Such differences would be expected to influence the regulatory programs of the infused product, yet these programs remain incompletely characterized. A prior study (Yu et al., J Immunother Cancer 2025) profiled the same 57 infusion products by single-cell RNA sequencing and reported enrichment of central-memory and effector states in axi-cel products and of proliferative states in tisa-cel products. Whether the products additionally differ in pathway and transcription factor activity within matched cell types has not been established. Objective: To determine whether axi-cel and tisa-cel products differ in inferred pathway and transcription factor activity when compared within matched transcriptional states. Methods Data. This was a secondary analysis of a publicly available single-cell RNA-sequencing dataset (NCBI GEO GSE297676) containing 57 preinfusion CAR T-cell products — 39 axi-cel and 18 tisa-cel — from patients with relapsed or refractory large B-cell lymphoma. After quality control, 92,191 cells were retained. Features corresponding to the CAR transgene were excluded so that product identity could not itself drive gene-level results. Cell states. Rather than re-clustering the data, we used the cell-type annotations supplied with the dataset and collapsed them into seven transcriptional states. This allowed the two products to be compared within matched cell states rather than only in aggregate. Pseudobulk profiles. For each product and each state, counts were summed across all cells of that state to give one profile per product per state. This treats the infusion product, not the individual cell, as the unit of replication, avoiding the inflated significance that results when many cells from one patient are counted as independent observations. Profiles required at least 50 cells, and a state was analyzed only if at least three products from each arm qualified. Activity inference. PROGENy and DoRothEA, applied through the decoupleR framework, were used to estimate pathway and transcription factor activity. Rather than measuring regulators directly, these methods infer activity from the coordinated expression of each regulator’s known target genes — a mechanistic read-out distinct from conventional gene-set enrichment. Fourteen pathways and 292 transcription factors were scored in each state. Statistical modeling. Activity was compared between products within each state using linear models (limma). A primary model tested product alone; a sensitivity model additionally adjusted for clinical response. Benjamini– Hochberg correction was applied across all state-by-feature tests within each method, rather than within each state separately. Robust findings. A feature was called robust only if it reached a false discovery rate below 0.05 in both models with the same direction of effect. Treg-like cells contained no tisa-cel responder profiles, so response adjustment was not interpretable in that state; those results are reported from the primary model only. Table 1. Study cohort Axi-cel Tisa-cel Products, n 39 18 Cells analyzed, n 70,671 21,520 Responders, n 15 4 Non-responders, n 24 14 Table 2. Cell states and sample-state profiles analyzed State Cells Profiles (axi/tisa) CD4-like 18,034 45 (32/13) CD8-like 22,095 46 (34/12) Central-memory-like 12,709 40 (29/11) Proliferating 24,789 52 (36/16) Th17-like 10,220 40 (28/12) Treg-like* 3,619 29 (25/4) Immune-associated 725 not modeled *Treg-like cells had no tisa-cel responder profiles; these results come from the primary model only and are excluded from the robustness classification. Results: cell-state composition Figure 1. UMAP projection of all 92,191 infusion-product cells, colored by the seven harmonized transcriptional states used throughout the analysis. Figure 2. Proportion of each transcriptional state within axi-cel and tisa-cel products, pooled across all cells of each product type. • Cells were assigned to seven harmonized transcriptional states, enabling comparison of products within matched cell types • Axi-cel products contained higher proportions of CD8-like (26.9% vs 14.4%) and central-memory-like cells (15.5% vs 8.3%) • Tisa-cel products contained higher proportions of proliferating (34.1% vs 24.7%) and Th17-like cells (19.7% vs 8.5%) Results: whole-product expression • Of 13,297 genes tested, 5,923 were differentially expressed between products at FDR <0.05 • 2,750 genes were higher in tisa-cel and 3,173 were higher in axi-cel • Genes most strongly associated with tisa-cel included DGKI, ENPP2, SSTR2 and GNG4 • Genes most strongly associated with axi-cel included CSF2RA, CDKN2A, MAN1C1 and NSG1 Results: pathway and transcription factor activity Figure 3. Pathway activity differences between products within each cell state, showing the eight strongest robust associations per state. Color indicates the direction and size of the difference (positive = higher in tisa-cel); point size indicates statistical confidence. Figure 4. Transcription factor activity differences between products within each cell state, showing the eight strongest robust associations per state. Color and point size are as in Figure 3. • 84 pathway-state and 1,752 transcription factor-state comparisons were evaluated within matched cell states • 40 pathway and 421 transcription factor associations met robust criteria: FDR <0.05 in both the primary and response-adjusted models with concordant direction of effect • Five pathways were robust in all five modeled states — TGFβ, NF-κB and estrogen higher in tisa-cel; hypoxia and TNFα higher in axi-cel • Robust transcription factor associations by state: proliferating 111, CD8-like 91, CD4-like 81, Th17-like 74, central-memory-like 64 Results: representative activity differences A B C D Figure 5. Four representative robust associations shown as full distributions, with each point representing one infusion product. (A) TGFβ pathway activity in CD8-like cells. (B) NF-κB pathway activity in central-memory-like cells. (C) E2F4 transcription factor activity in CD8-like cells. (D) TWIST1 transcription factor activity in proliferating cells. Conclusions • Axi-cel and tisa-cel products differ not only in which cell types they contain but in the regulatory programs active inside those cells. Because comparisons were made within matched transcriptional states, these differences cannot be explained by cell-type composition alone. • Across the five states with adequate representation from both products, 461 regulatory features were robust — 40 pathway-state and 421 transcription factor-state associations — each significant both before and after adjusting for clinical response, with a consistent direction of effect. The direction was notably asymmetric: 312 of the 421 transcription factor associations showed higher inferred activity in tisa-cel. • A convergent signal from the E2F family reproduces the heightened proliferative program previously reported in tisa-cel using a different analytical approach, which supports the validity of the regulon-based method used here. • Several regulators not individually highlighted in prior work — NFIC, ZBED1, TWIST1, HOXA9, HOXB7 and RXRA — emerged as candidate product-associated factors and represent hypotheses for future functional testing. Limitations. This is a secondary analysis of a non-randomized cohort, and the two arms differed at baseline in performance status, prior lines of therapy and prior autologous transplant; these factors were not modeled. Treg-like cells contained no tisa-cel responder profiles, so response adjustment could not be interpreted for that state. Only four tisa-cel responders were available in total, and the response adjustment in every other state rests on the same three patients. Activity scores are inferred from computational models rather than measured directly. References 1. Yu X, et al. J Immunother Cancer 2025;13:e011807. 2. Jacobson CA, et al. Transplant Cell Ther 2024;30:77.e1-77.e15. 3. Bachy E, et al. Nat Med 2022. 4. Philipson BI, et al. Sci Signal 2020;13:eaay8248. 5. Badia-i-Mompel P, et al. Bioinform Adv 2022;2:vbac016. 6. Schubert M, et al. Nat Commun 2018;9:20. 7. Garcia-Alonso L, et al. Genome Res 2019;29:1363. Acknowledgements. Data generated by Yu et al. and made publicly available through NCBI GEO (GSE297676). Contact: trenton-gibson@ou.edu