1,267 posters, 47 videos, 13 topics, 4 sessions, 853 authors
ePostersLive by SciGen Technologies S.A. All rights reserved.
SOHO 2026 Annual Meeting
September 9 - 12, 2026 | George R. Brown Convention Center, Houston, Texas

AML - 758
Co-Mutational Patterns and Transcriptomic Heterogeneity Within NPM1-Mutated Acute Myeloid Leukemia: An Integrative Analysis Using the ASH HematOmics Program
Poster Presenter
Authors
Part of Topic
Acute Myeloid Leukemia (AML)
Abstract
Context
NPM1-mutated AML, the largest molecular AML subgroup (~30% of AML), exhibits significant outcome heterogeneity driven by co-occurring mutations. Two menin inhibitors, revumenib and ziftomenib, were recently FDA-approved and work by blocking the HOX/MEIS1 pathway that drives NPM1-mutated AML. Understanding how different co-mutations affect gene expression patterns may help identify new treatment targets and guide therapy in these patients.
Design
We used the ASH HematOmics Program (ASHOP), an open-access platform integrating genomic, transcriptomic, and clinical data from hematologic malignancies, to perform an integrated analysis of NPM1-mutated AML. NPM1-mutated AML patients were identified from the ASHOP database. Co-mutation landscapes were characterized using matrix and lollipop plots. Patients were stratified into co-mutation subgroups: NPM1/FLT3/DNMT3A, NPM1/DNMT3A, NPM1/IDH1-2, NPM1/TET2, and NPM1 with (MRG) mutations, which are ASXL1, SRSF2, BCOR, EZH2, U2AF1, STAG2, ZRSR2, and SF3B1. Unsupervised UMAP clustering of RNA sequencing data identified transcriptomic subclusters. Differential expression analysis performed by edgeR focused on the above-mentioned subgroup comparisons. Pathway enrichment analysis was performed. Clinical outcomes, such as survival data, were not available for this subgroup.
Results
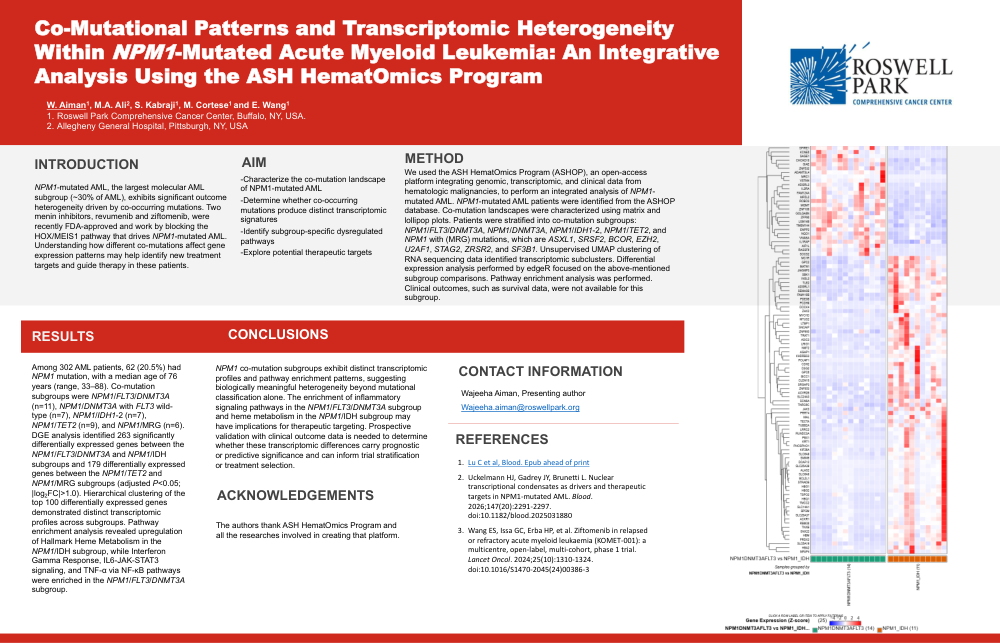
Among 302 AML patients, 62 (20.5%) had NPM1 mutation, with a median age of 76 years (range, 33–88). Co-mutation subgroups were NPM1/FLT3/DNMT3A (n=11), NPM1/DNMT3A with FLT3 wild-type (n=7), NPM1/IDH1-2 (n=7), NPM1/TET2 (n=9), and NPM1/MRG (n=6). DGE analysis identified 263 significantly differentially expressed genes between the NPM1/FLT3/DNMT3A and NPM1/IDH subgroups and 179 differentially expressed genes between the NPM1/TET2 and NPM1/MRG subgroups (adjusted P<0.05; |log2FC|>1.0). Hierarchical clustering of the top 100 differentially expressed genes demonstrated distinct transcriptomic profiles across subgroups. Pathway enrichment analysis revealed upregulation of Hallmark Heme Metabolism in the NPM1/IDH subgroup, while Interferon Gamma Response, IL6-JAK-STAT3 signaling, and TNF-α via NF-κB pathways were enriched in the NPM1/FLT3/DNMT3A subgroup.
Conclusions
NPM1 co-mutation subgroups exhibit distinct transcriptomic profiles and pathway enrichment patterns, suggesting biologically meaningful heterogeneity beyond mutational classification alone. The enrichment of inflammatory signaling pathways in the NPM1/FLT3/DNMT3A subgroup and heme metabolism in the NPM1/IDH subgroup may have implications for therapeutic targeting. Prospective validation with clinical outcome data is needed to determine whether these transcriptomic differences carry prognostic or predictive significance and can inform trial stratification or treatment selection.