2,281 posters, 63 videos, 56 audios, 43 topics, 18 sessions, 6,174 authors, 2,323 institutions
ePostersLive by SciGen Technologies S.A. All rights reserved.
RCOG World Congress 2025
June 23 - 25, 2025 | ExCeL London, UK
EP.0424
Significant variance exists between customized and Hadlock estimated fetal weight charts.
Poster Presenter
Part of Topic
Fetal medicine
Title
Significant variance exists between customised and Hadlock
estimated fetal weight charts.
Objective
Ascertain if 100% compliance was achieved on plotting the estimated fetal weight (EFW) on
the Customized Growth Chart (GROW 2.0, Perinatal institute).
Design
Retrospective audit of CGC documentation to allow completeness of data collection.
Methods
Data were retrospectively collected from 49 consecutive singleton births over a one-week
period (22nd to 29th November 2024) in our maternity unit (West Midlands, Annual birth rate
~7400, Level 3 NICU facilities). Only live born pregnancies with a 1st trimester estimated due
date ascertained by ultrasound scan and without congenital anomalies were included. EFW
was calculated using Hadlock’s formula using the head circumference, abdominal
circumference and femur length. The EFW (g) was manually entered into GROW 2.0 by clinical
staff. Data were analysed using Microsoft Excel (Windows 365), and Graphpad Prism 5.0 for
Windows.Results
A total of 153 growth scans were undertaken in 49 women (mean 3, Range: 1-5). 65% were
not of white ethnicity- the most common ethnic minority group were women who identified
as Pakistani (27%, 13/79) ethnicity. The median BMI was 28.2 (IQR 23.3-32.7kg/m2). Scan
reported EFWs were transcribed to the GROW 2.0 in all instances.
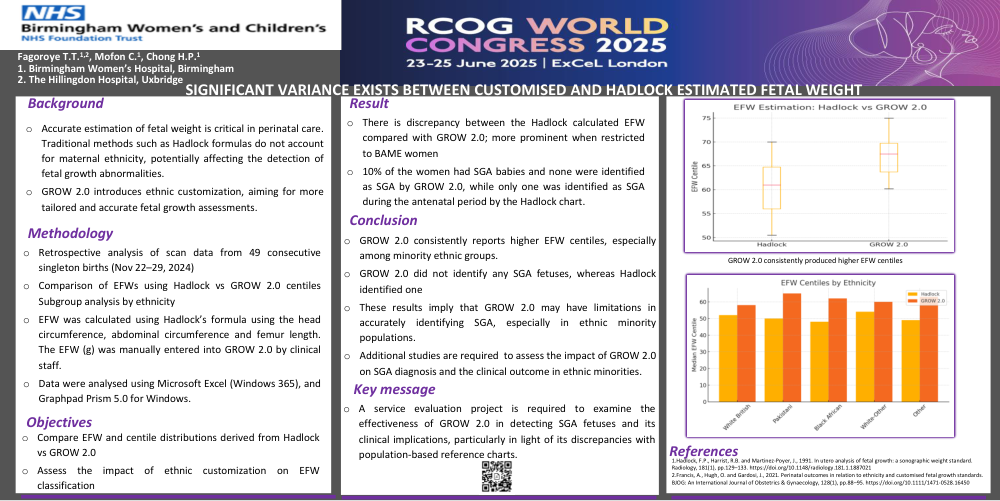
However, our audit identified a discrepancy between the Hadlock calculated EFW (Median
50.5%, IQR 29.5-68.3) compared with GROW 2.0 (median 60.2%, IQR 38.1-80.8, Wilcoxon
matched-pairs signed rank p <0.0001). This discrepancy was more prominent when analyses
were restricted to BAME women: median EFW 52.0% (Hadlock, IQR 28.5-63.8) vs 65.0%
[GROW 2.0, (IQR 45-84.3), Wilcoxon matched-pairs signed rank p <0.0001].
10% (4/49) of the women had SGA babies (birthweight <10th centile) and none were identified
as SGA by GROW 2.0, while only one was identified as SGA during the antenatal period by the
Hadlock chart.
Conclusion
1.Although the process of inputting data into GROW 2.0 is manually undertaken in our
unit, this was completed for all patients in this audit.
2.A service evaluation project to evaluate the detection of SGA fetuses is warranted to
assess the clinical impact of using GROW 2.0 given the discrepancy between GROW
2.0 compared with population-based charts.