2,281 posters, 63 videos, 56 audios, 43 topics, 18 sessions, 6,174 authors, 2,323 institutions
ePostersLive by SciGen Technologies S.A. All rights reserved.
RCOG World Congress 2025
June 23 - 25, 2025 | ExCeL London, UK
PP.0046
Reduction of stillbirths supported by electronic assessment of fetal growth velocity
Poster Presenter
Authors
Emily Butler, Hanna Ellson, Hanna Taylor, Jemma Mytton, Oliver Hugh, Jason Gardosi
Affiliations
Part of Topic
Quality improvement
Reduction of stillbirths with digital support
for assessment of fetal growth velocity
Emily Butler, Hanna Ellson, Hannah Taylor, Jemma Mytton, Oliver Hugh, Jason Gardosi
Perinatal Institute, Birmingham, UK
Objective
•The new electronic customised growth charts (GROW 2.0)
includes auto-plotting, calculation of growth velocity,
and prompts for clinical risk assessment and review.
includes auto-plotting, calculation of growth velocity,
and prompts for clinical risk assessment and review.
•We assessed the effect of implementation on stillbirth rates.
Methods
•Growth velocity assessment is by the projected optimal
weight range (POWR) method 1 and prompts clinical
review if slow growth is detected.
weight range (POWR) method 1 and prompts clinical
review if slow growth is detected.
•Previously, growth velocity based on serial ultrasound
estimated fetal weight (EFW) was assessed only visually
estimated fetal weight (EFW) was assessed only visually
•We analysed routinely recorded 2024 data from the
first 44 NHS Trusts that had implemented GROW 2.0
first 44 NHS Trusts that had implemented GROW 2.0
We compared it with data from the same 44 units
between 2020-2022, when only printed charts were in use
between 2020-2022, when only printed charts were in use
Results
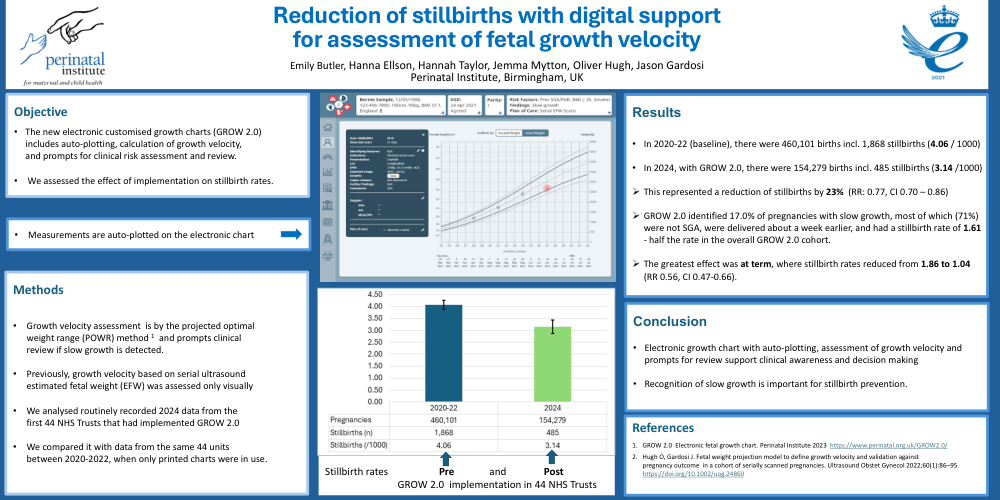
•In 2020-22 (baseline), there were 460,101 births incl. 1,868 stillbirths (4.06 / 1000)
•In 2024, with GROW 2.0, there were 154,279 births incl. 485 stillbirths (3.14 /1000)
•This represented a reduction of stillbirths by 23% (RR: 0.77, CI 0.70 – 0.86)
•GROW 2.0 identified 17.0% of pregnancies with slow growth, most of which (71%) were not SGA, were delivered about a week earlier, and had a stillbirth rate of 1.61 - half the rate in the overall GROW 2.0 cohort.
•The greatest effect was at term, where stillbirth rates reduced from 1.86 to 1.04
(RR 0.56, CI 0.47-0.66).
(RR 0.56, CI 0.47-0.66).
Conclusion
•Electronic growth chart with auto-plotting, assessment of growth velocity and prompts for review support clinical awareness and decision making
•Recognition of slow growth is important for stillbirth prevention.
References
1.GROW 2.0 Electronic fetal growth chart. Perinatal Institute 2023 https://www.perinatal.org.uk/GROW2.0/
2.Hugh O, Gardosi J. Fetal weight projection model to define growth velocity and validation against
pregnancy outcome in a cohort of serially scanned pregnancies. Ultrasound Obstet Gynecol 2022;60(1):86–95. https://doi.org/10.1002/uog.24860
pregnancy outcome in a cohort of serially scanned pregnancies. Ultrasound Obstet Gynecol 2022;60(1):86–95. https://doi.org/10.1002/uog.24860