2,281 posters, 63 videos, 56 audios, 43 topics, 18 sessions, 6,174 authors, 2,323 institutions
ePostersLive by SciGen Technologies S.A. All rights reserved.
RCOG World Congress 2025
June 23 - 25, 2025 | ExCeL London, UK
PP.0019
Twin vs singleton growth charts in diagnosing SGA in twin pregnancy
Poster Presenter
Authors
Sara Sorrenti, Daniele Di Mascio, Asma Khalil, Francesco D'Antonio, Fabrizio Zullo, Elena D'Alberti, Valentina D'Ambrosio, Ilenia Mappa, Antonella Giancotti, Giuseppe Rizzo
Affiliations
"Sapienza" University of Rome, St George's University of London, Università G. D'Annunzio Chieti-Pescara, University of Roma Tor Vergata
Part of Topic
Fetal medicine
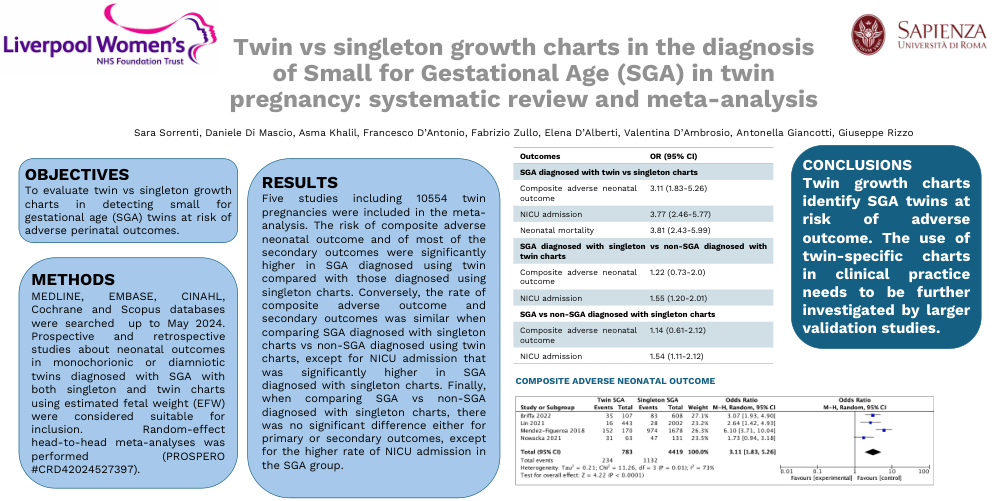
Twin vs singleton growth charts in the diagnosis of Small for Gestational Age (SGA) in twin pregnancy: systematic review and meta-analysis
OBJECTIVES
To evaluate twin vs singleton growth charts in detecting small for gestational age (SGA) twins at risk of adverse perinatal outcomes.
METHODS
MEDLINE, EMBASE, CINAHL, Cochrane and Scopus databases were searched up to May 2024. Prospective and retrospective studies about neonatal outcomes in monochorionic or diamniotic twins diagnosed with SGA with both singleton and twin charts using estimated fetal weight (EFW) were considered suitable for inclusion. Random‐effect head‐to‐head meta‐analyses was performed (PROSPERO #CRD42024527397).
RESULTS
Five studies including 10554 twin pregnancies were included in the meta-analysis. The risk of composite adverse neonatal outcome and of most of the secondary outcomes were significantly higher in SGA diagnosed using twin compared with those diagnosed using singleton charts. Conversely, the rate of composite adverse outcome and secondary outcomes was similar when comparing SGA diagnosed with singleton charts vs non-SGA diagnosed using twin charts, except for NICU admission that was significantly higher in SGA diagnosed with singleton charts. Finally, when comparing SGA vs non-SGA diagnosed with singleton charts, there was no significant difference either for primary or secondary outcomes, except for the higher rate of NICU admission in the SGA group
CONCLUSIONS
Twin growth charts identify SGA twins at risk of adverse outcome. The use of twin-specific charts in clinical practice needs to be further investigated by larger validation studies.