2,281 posters, 63 videos, 56 audios, 43 topics, 18 sessions, 6,174 authors, 2,323 institutions
ePostersLive by SciGen Technologies S.A. All rights reserved.
RCOG World Congress 2025
June 23 - 25, 2025 | ExCeL London, UK
EP.1466
AUDIT OF CAESERIAN SECTION RATE using Robson’s Ten Group Classification System
Poster Presenter
Part of Topic
Labour ward management
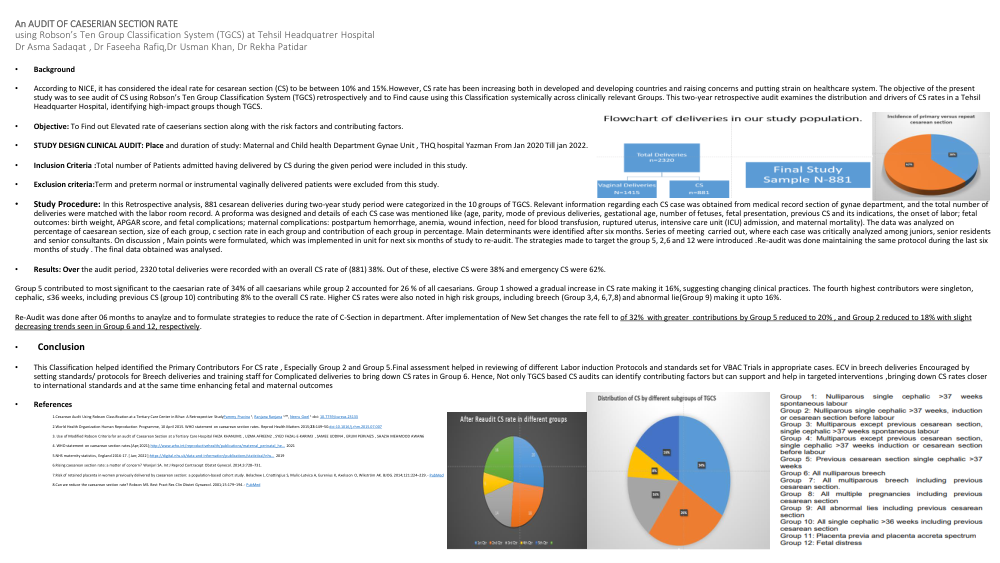
using Robson’s Ten Group Classification System (TGCS) at Tehsil Headquatrer Hospital Dr Asma Sadaqat , Dr Faseeha Rafiq,Dr Usman Khan, Dr Rekha Patidar • Background • According to NICE, it has considered the ideal rate for cesarean section (CS) to be between 10% and 15%.However, CS rate has been increasing both in developed and developing countries and raising concerns and putting strain on healthcare system. The objective of the present study was to see audit of CS using Robson’s Ten Group Classification System (TGCS) retrospectively and to Find cause using this Classification systemically across clinically relevant Groups. This two-year retrospective audit examines the distribution and drivers of CS rates in a Tehsil Headquarter Hospital, identifying high-impact groups though TGCS. • Objective: To Find out Elevated rate of caeserians section along with the risk factors and contributing factors. • STUDY DESIGN CLINICAL AUDIT: Place and duration of study: Maternal and Child health Department Gynae Unit , THQ hospital Yazman From Jan 2020 Till jan 2022. • Inclusion Criteria :Total number of Patients admitted having delivered by CS during the given period were included in this study. • Exclusion criteria:Term and preterm normal or instrumental vaginally delivered patients were excluded from this study. • Study Procedure: In this Retrospective analysis, 881 cesarean deliveries during two-year study period were categorized in the 10 groups of TGCS. Relevant information regarding each CS case was obtained from medical record section of gynae department, and the total number of deliveries were matched with the labor room record. A proforma was designed and details of each CS case was mentioned like (age, parity, mode of previous deliveries, gestational age, number of fetuses, fetal presentation, previous CS and its indications, the onset of labor; fetal outcomes: birth weight, APGAR score, and fetal complications; maternal complications: postpartum hemorrhage, anemia, wound infection, need for blood transfusion, ruptured uterus, intensive care unit (ICU) admission, and maternal mortality). The data was analyzed on percentage of caesarean section, size of each group, c section rate in each group and contribution of each group in percentage. Main determinants were identified after six months. Series of meeting carried out, where each case was critically analyzed among juniors, senior residents and senior consultants. On discussion , Main points were formulated, which was implemented in unit for next six months of study to re-audit. The strategies made to target the group 5, 2,6 and 12 were introduced .Re-audit was done maintaining the same protocol during the last six months of study . The final data obtained was analysed. • Results: Overthe audit period, 2320 total deliveries were recorded with an overall CS rate of (881) 38%. Out of these, elective CS were 38% and emergency CS were 62%. Group 5 contributed to most significant to the caesarian rate of 34% of all caesarians while group 2 accounted for 26 % of all caesarians. Group 1 showed a gradual increase in CS rate making it 16%, suggesting changing clinical practices. The fourth highest contributors were singleton, cephalic, ≤36 weeks, including previous CS (group 10) contributing 8% to the overall CS rate. Higher CS rates were also noted in high risk groups, including breech (Group 3,4, 6,7,8) and abnormal lie(Group 9) making it upto 16%. Re-Audit was done after 06 months to anaylze and to formulate strategies to reduce the rate of C-Section in department. After implementation of New Set changes the rate fell to decreasing trends seen in Group 6 and 12, respectively . • Conclusion of 32% with greater contributions by Group 5 reduced to 20% , and Group 2 reduced to 18% with slight • This Classification helped identified the Primary Contributors For CS rate , Especially Group 2 and Group 5.Final assessment helped in reviewing of different Labor induction Protocols and standards set for VBAC Trials in appropriate cases. ECV in breech deliveries Encouraged by setting standards/ protocols for Breech deliveries and training staff for Complicated deliveries to bring down CS rates in Group 6. Hence, Not only TGCS based CS audits can identify contributing factors but can support and help in targeted interventions ,bringing down CS rates closer to international standards and at the same time enhancing fetal and maternal outcomes • References 1.Cesarean Audit Using Robson Classification at a Tertiary Care Center in Bihar: A Retrospective StudyPammy Pravina 1, Ranjana Ranjana 1,✉, Neeru Goel 1 doi: 10.7759/cureus.23133 2.World Health Organization Human Reproduction Programme, 10 April 2015.WHO statement on caesarean section rates. Reprod Health Matters 2015;23:149–50.doi:10.1016/j.rhm.2015.07.00 3. Use of Modified Robson Criteria for an audit of Caesarean Section at a Tertiary Care Hospital FAIZA KHANUM1 , UZMA AFREEN2 , SYED FAZAL-E-KARIM3 , SAMEE UDDIN4 , ERUM PERVAIZ5 , SHAZIA MEHMOOD AWAN6 4. WHO statement on caesarean section rates.[Apr;2021];http://www.who.int/ reproductivehealth/publications/maternal_perinatal_he... 2021 5.NHS maternity statistics, England 2016-17. [ Jan; 2022 ]; https://digital.nhs.uk/data-and-information/publications/statistical/nhs... 2019 6.Rising caesarean section rate: a matter of concern? Wanjari SA. Int J Reprod Contracept Obstet Gynecol. 2014;3:728–731. 7.Risk of retained placenta in women previously delivered by caesarean section: a population-based cohort study. Belachew J, Cnattingius S, Mulic-Lutvica A, Eurenius K, Axelsson O, Wikström AK. BJOG. 2014;121:224–229. - PubMed 8.Can we reduce the caesarean section rate? Robson MS. Best Pract Res ClinObstet Gynaecol. 2001;15:179–194. - PubMed]