586 posters, 8 topics, 23 sessions, 1,077 authors, 622 institutions
ePostersLive by SciGen Technologies S.A. All rights reserved.
ISQua's 40th International Conference 2024
24th - 27th September 2024 | Istanbul, Türkiye

P564
New Trends in Improving Efficiency and Care Quality: Optimizing Medical Care for Peritoneal Dialysis Patients through BCM Data Visualization
Poster Presenter
Authors
Affiliations
Part of Topic
Future of Healthcare: AI and Digital Transformation
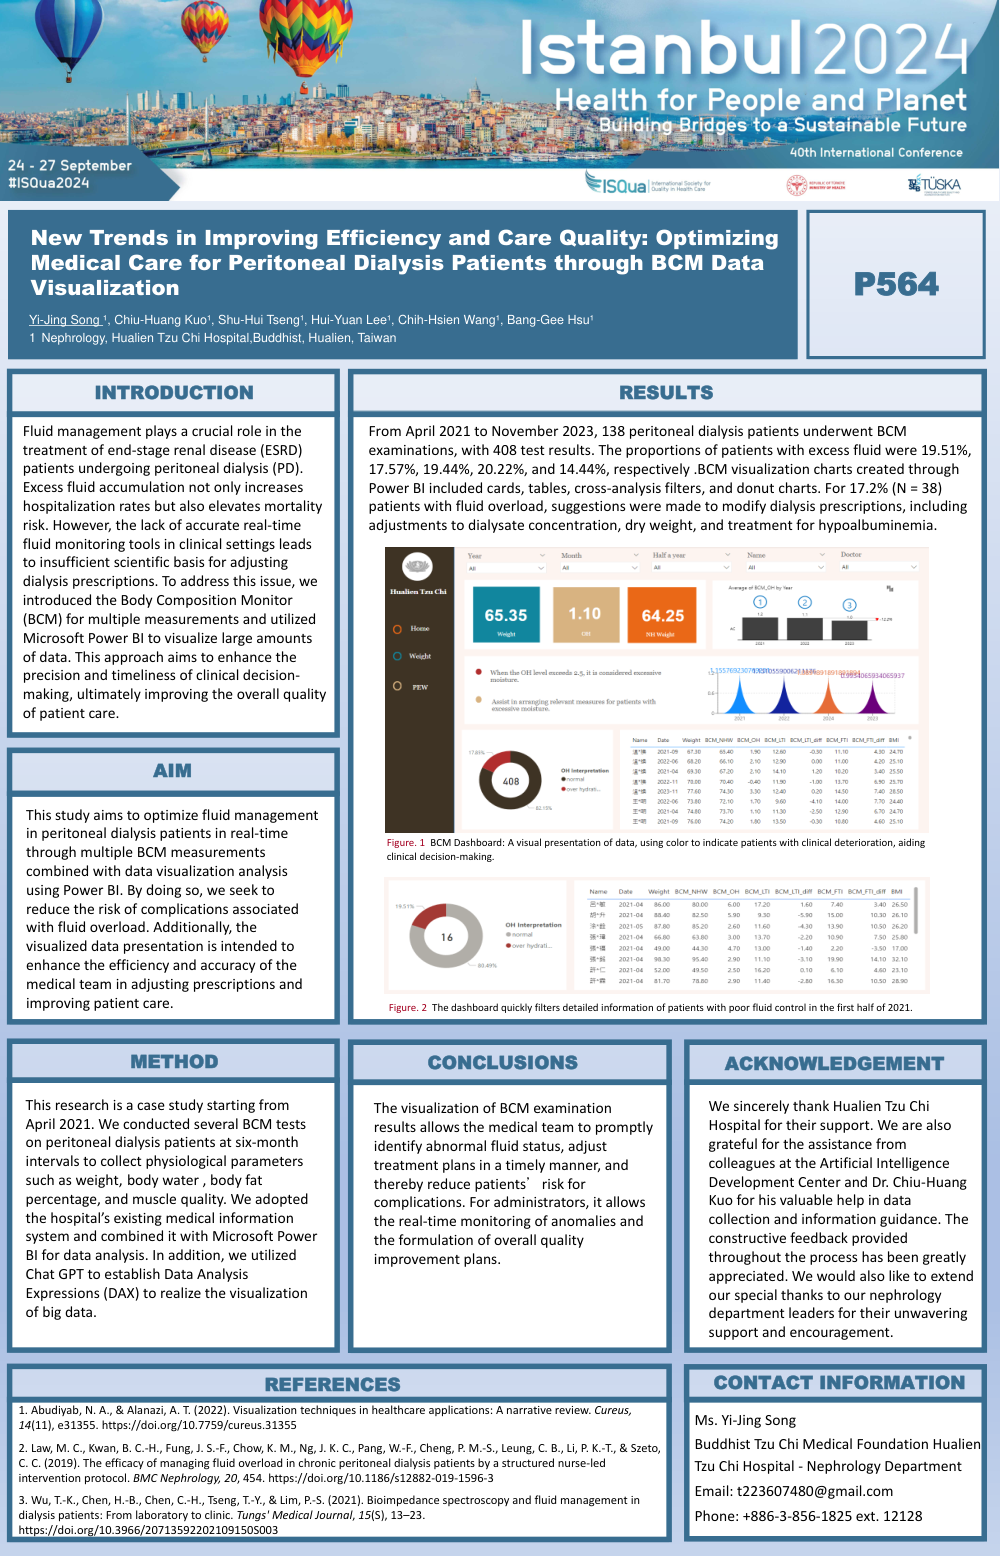
New Trends in Improving Efficiency and Care Quality: Optimizing Medical Care for Peritoneal Dialysis Patients through BCM Data Visualization
Yi-Jing Song ¹, Chiu-Huang Kuo¹, Shu-Hui Tseng¹, Hui-Yuan Lee¹, Chih-Hsien Wang¹, Bang-Gee Hsu¹
1 Nephrology, Hualien Tzu Chi Hospital,Buddhist, Hualien, Taiwan
INTRODUCTION:
Fluid management plays a crucial role in the treatment of end-stage renal disease (ESRD) patients undergoing peritoneal dialysis (PD). Excess fluid accumulation not only increases hospitalization rates but also elevates mortality risk. However, the lack of accurate real-time fluid monitoring tools in clinical settings leads to insufficient scientific basis for adjusting dialysis prescriptions. To address this issue, we introduced the Body Composition Monitor (BCM) for multiple measurements and utilized Microsoft Power BI to visualize large amounts of data. This approach aims to enhance the precision and timeliness of clinical decision-making, ultimately improving the overall quality of patient care.
AIM:
This study aims to optimize fluid management in peritoneal dialysis patients in real-time through multiple BCM measurements combined with data visualization analysis using Power BI. By doing so, we seek to reduce the risk of complications associated with fluid overload. Additionally, the visualized data presentation is intended to enhance the efficiency and accuracy of the medical team in adjusting prescriptions and improving patient care.
METHOD:
This research is a case study starting from April 2021. We conducted several BCM tests on peritoneal dialysis patients at six-month intervals to collect physiological parameters such as weight, body water , body fat percentage, and muscle quality. We adopted the hospital’s existing medical information system and combined it with Microsoft Power BI for data analysis. In addition, we utilized Chat GPT to establish Data Analysis Expressions (DAX) to realize the visualization of big data.
CONCLUSIONS:
The visualization of BCM examination results allows the medical team to promptly identify abnormal fluid status, adjust treatment plans in a timely manner, and thereby reduce patients’risk for complications. For administrators, it allows the real-time monitoring of anomalies and the formulation of overall quality improvement plans.