708 posters, 8 topics, 16 sessions, 1,190 authors, 600 institutions
ePostersLive by SciGen Technologies S.A. All rights reserved.
ISQua's 39th International Conference 2023
August 27 - 30, 2023 | Seoul, Republic of Korea

P260
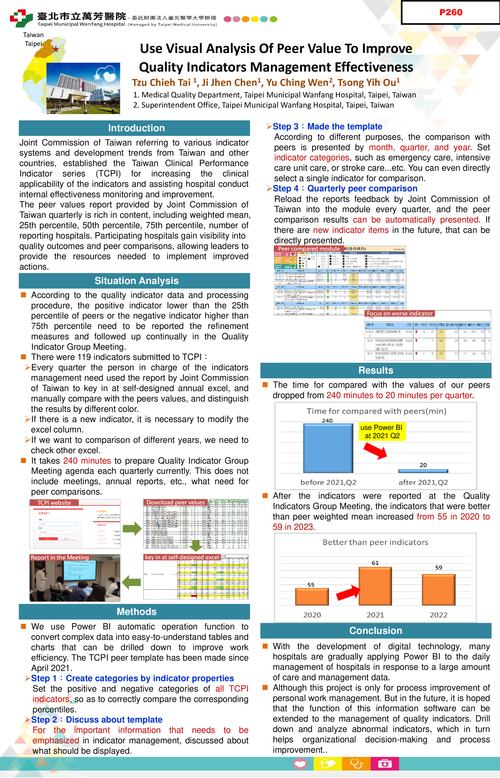
USE VISUAL ANALYSIS OF PEER VALUE TO IMPROVE QUALITY INDICATORS MANAGEMENT EFFECTIVENESS
Poster Presenter
Authors
Affiliations
Part of Topic
Patient Safety & Quality Improvement
Introduction:
Joint Commission of Taiwan referring to various indicator systems and development trends from Taiwan and other countries, established the Taiwan Clinical Performance Indicator series (TCPI) for increasing the clinical applicability of the indicators and assisting hospital conduct internal effectiveness monitoring and improvement.
The peer values report provided by Joint Commission of Taiwan quarterly is rich in content, including weighted mean,25th percentile, 50th percentile, 75th percentile, number of reporting hospitals. Participating hospitals gain visibility into quality outcomes and peer comparisons, allowing leaders to provide the resources needed to implement improved actions.
Methods:
According to the quality indicator data and processing procedure, the positive indicator lower than the 25th percentile of peers or the negative indicator higher than 75th percentile need to be reported the refinement measures and followed up continually in the Quality Indicator Group Meeting.
There were 119 indicators submitted to TCPI. Every quarter the person in charge of the indicators management need used the report by Joint Commission of Taiwan to key in at self-designed annual excel, and manually compare with the peers values, and distinguish the results by different color. If there is a new indicator, it is necessary to modify the excel column. If want to comparison of different years, we need to check other excel. It takes 240 minutes to prepare Quality Indicator Group Meeting agenda each quarterly currently. This does not include meetings, annual reports, etc., what need for peer comparisons. So we use Power BI automatic operation function to convert complex data into easy-to-understand tables and charts that can be drilled down to improve work efficiency. The TCPI peer template has been made since April 2021.
Step 1:Create categories by indicator properties
Set the positive and negative categories of all TCPI indicators, so as to correctly compare the corresponding percentiles.
Step 2:discuss about template
For the important information that needs to be emphasized in indicator management, discussed about what should be displayed.
Step 3:Made the template
According to different purposes, the comparison with peers is presented by month, quarter, and year. Set indicator categories, such as emergency care, intensive care unit care, or stroke care...etc. You can even directly select a single indicator for comparison.
Step 4:Quarterly peer comparison
Reload the Excel reports feedback by Joint Commission of Taiwan into the module every quarter, and the peer comparison results can be automatically presented. If there are new indicator items in the future, the report can be directly presented no need to reset the statistical method.
Results:
Reload the reports feedback by Joint Commission of Taiwan into the module every quarter, and comparison results can be automatically presented. If there are new indicator items in the future, the report can be directly presented no need to reset the statistical method.The time for compared with the values of our peers dropped from 240 minutes to 20 minutes per quarter.
After the indicators were reported at the Quality Indicators Group Meeting, the indicators that were better than peer weighted mean increased from 55 in 2020 to 61 in 2021.
Conclusion:
With the development of digital technology, many hospitals are gradually applying Power BI to the daily management of hospitals in response to a large amount of care and management data. Although this project is only for process improvement of personal work management. But in the future, it is hoped that the function of this information software can be extended to the management of quality indicators. Drill down and analyze abnormal indicators, which in turn helps organizational decision-making and process improvement.