92 posters, 1 audios, 567 authors, 81 institutions
ePostersLive by SciGen Technologies S.A. All rights reserved.
Data-driven Cancer Research Conference 2026
24-26 February 2026 | Edinburgh, Scotland

P07
Evaluation of the Tyrer-Cuzick v8 Model for Breast Cancer Risk Stratification in a UK Family History Clinic
Poster Presenter
Authors
Affiliations
Part of Topic
Audio
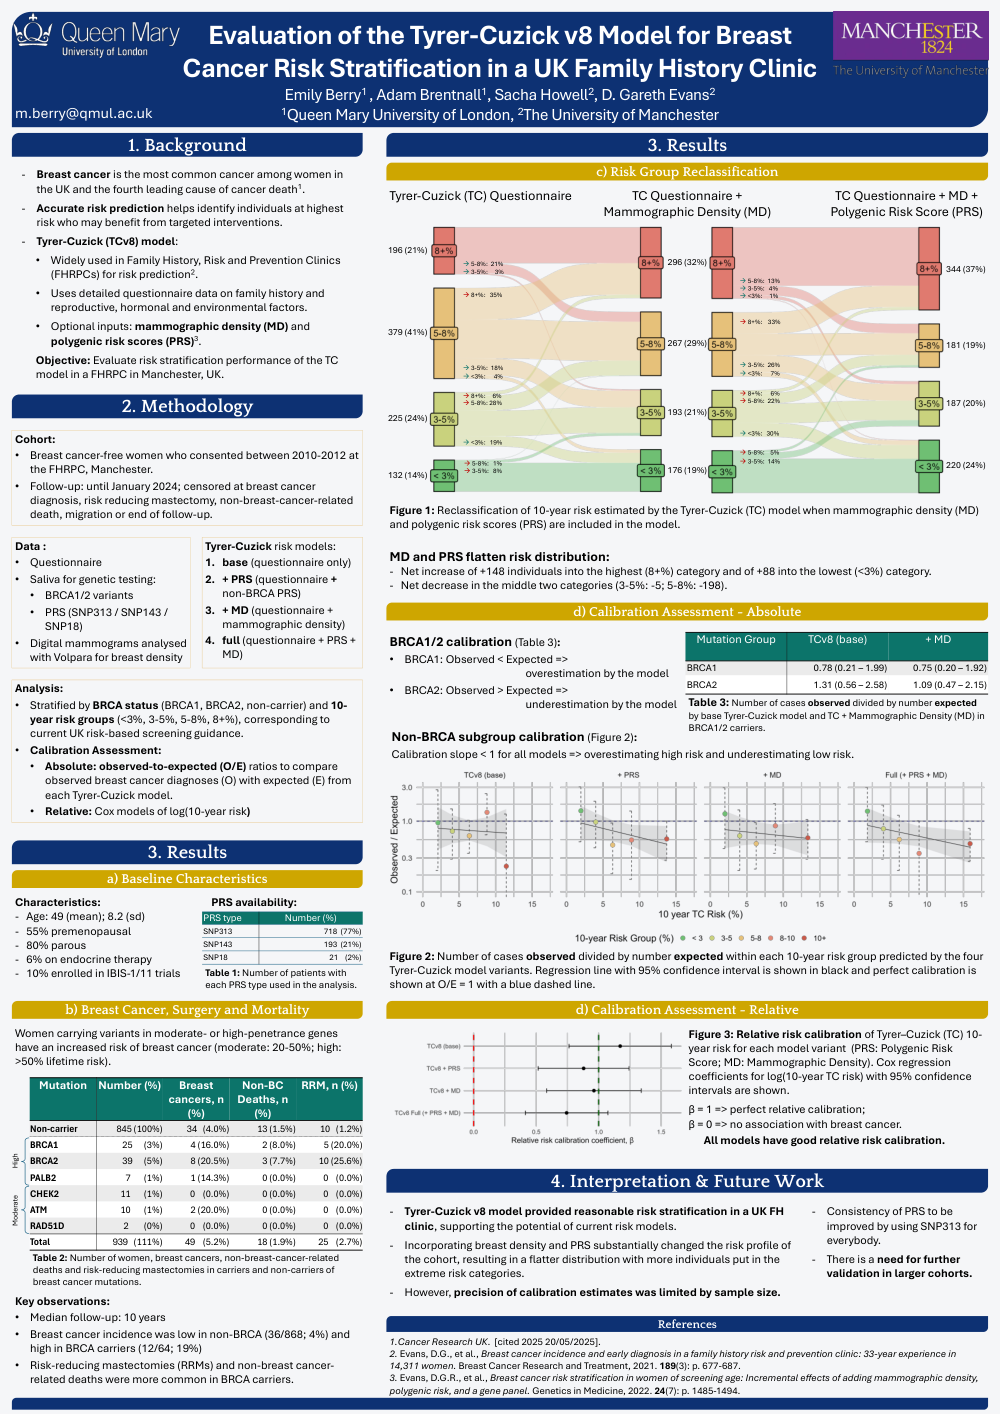
Evaluation of the Tyrer-Cuzick v8 Model for Breast Cancer Risk Stratification in a UK Family History Clinic
Emily Berry1 , Adam Brentnall1, Sacha Howell2, D. Gareth Evans2
1Queen Mary University of London, 2The University of Manchester
1. Background:
- Breast cancer is the most common cancer among women in the UK and the fourth leading cause of cancer death1.
- Accurate risk prediction helps identify individuals at highest risk who may benefit from targeted interventions.
- Tyrer-Cuzick (TCv8) model:
- Widely used in Family History, Risk and Prevention Clinics (FHRPCs) for risk prediction2.
- Uses detailed questionnaire data on family history and reproductive, hormonal and environmental factors.
- Optional inputs: mammographic density (MD) and polygenic risk scores (PRS)3.
Objective: Evaluate risk stratification performance of the TC model in a FHRPC in Manchester, UK.
2. Methodology:
Cohort:
- Breast cancer-free women who consented between 2010-2012 at the FHRPC, Manchester.
- Follow-up: until January 2024; censored at breast cancer diagnosis, risk reducing mastectomy, non-breast-cancer-related death, migration or end of follow-up.
Data :
- Questionnaire
- Saliva for genetic testing:
- BRCA1/2 variants
- PRS (SNP313 / SNP143 / SNP18)
- Digital mammograms analysed with Volpara for breast density
Tyrer-Cuzick risk models:
- base (questionnaire only)
- + PRS (questionnaire + non-BRCA PRS)
- + MD (questionnaire + mammographic density)
- full (questionnaire + PRS + MD)
Analysis:
- Stratified by BRCA status (BRCA1, BRCA2, non-carrier) and 10-year risk groups (<3%, 3-5%, 5-8%, 8+%), corresponding to current UK risk-based screening guidance.
- Calibration Assessment:
- Absolute: observed-to-expected (O/E) ratios to compare observed breast cancer diagnoses (O) with expected (E) from each Tyrer-Cuzick model.
- Relative: Cox models of log(10-year risk)
3. Results
a) Baseline characteristics:
Characteristics:
- Age: 49 (mean); 8.2 (sd)
- 55% premenopausal
- 80% parous
- 6% on endocrine therapy
- 10% enrolled in IBIS-1/11 trials
PRS availability: Table 1: Number of patients with each PRS type used in the analysis.
b) Breast Cancer, Surgery and Mortality:
Women carrying variants in moderate- or high-penetrance genes have an increased risk of breast cancer (moderate: 20-50%; high: >50% lifetime risk).
Table 2: Number of women, breast cancers, non-breast-cancer-related deaths and risk-reducing mastectomies in carriers and non-carriers of breast cancer mutations.
Key observations:
- Median follow-up: 10 years
- Breast cancer incidence was low in non-BRCA (36/868; 4%) and high in BRCA carriers (12/64; 19%)
- Risk-reducing mastectomies (RRMs) and non-breast cancer-related deaths were more common in BRCA carriers.
c) Risk Group Reclassification:
Figure 1: Reclassification of 10-year risk estimated by the Tyrer-Cuzick (TC) model when mammographic density (MD) and polygenic risk scores (PRS) are included in the model.
MD and PRS flatten risk distribution:
- Net increase of +148 individuals into the highest (8+%) category and of +88 into the lowest (<3%) category.
- Net decrease in the middle two categories (3-5%: -5; 5-8%: -198).
d) Calibration Assessment – Absolute:
BRCA1/2 calibration (Table 3):
- Table 3: Number of cases observed divided by number expected by base Tyrer-Cuzick model and TC + Mammographic Density (MD) in BRCA1/2 carriers.
- BRCA1: Observed < Expected => overestimation by the model
- BRCA2: Observed > Expected => underestimation by the model
Non-BRCA subgroup calibration (Figure 2):
- Calibration slope < 1 for all models => overestimating high risk and underestimating low risk.
- Figure 2: Number of cases observed divided by number expected within each 10-year risk group predicted by the four Tyrer-Cuzick model variants. Regression line with 95% confidence interval is shown in black and perfect calibration is shown at O/E = 1 with a blue dashed line.
e) Calibration Assessment – Relative:
- Figure 3: Relative risk calibration of Tyrer–Cuzick (TC) 10-year risk for each model variant (PRS: Polygenic Risk Score; MD: Mammographic Density). Cox regression coefficients for log(10-year TC risk) with 95% confidence intervals are shown.
- β = 1 => perfect relative calibration;
- β = 0 => no association with breast cancer.
- All models have good relative risk calibration.
4. Interpretation & Future Work
- Tyrer-Cuzick v8 model provided reasonable risk stratification in a UK FH clinic, supporting the potential of current risk models.
- Incorporating breast density and PRS substantially changed the risk profile of the cohort, resulting in a flatter distribution with more individuals put in the extreme risk categories.
- However, precision of calibration estimates was limited by sample size.
- Consistency of PRS to be improved by using SNP313 for everybody.
- There is a need for further validation in larger cohorts.
References
1. Cancer Research UK. [cited 2025 20/05/2025].
2. Evans, D.G., et al., Breast cancer incidence and early diagnosis in a family history risk and prevention clinic: 33-year experience in 14,311 women. Breast Cancer Research and Treatment, 2021. 189(3): p. 677-687.
3. Evans, D.G.R., et al., Breast cancer risk stratification in women of screening age: Incremental effects of adding mammographic density, polygenic risk, and a gene panel. Genetics in Medicine, 2022. 24(7): p. 1485-1494.
Comments
Email is required but is not shown publicly.
Loading comments...