127 posters, 2 topics, 24 sessions, 326 authors, 85 institutions
ePostersLive by SciGen Technologies S.A. All rights reserved.
2023 ACP ANNUAL SESSION
October 25-28 | San Diego, CA

96
Evaluation of Finishing Line Trueness in Digital Impressions: A Comparative Study of Two Techniques
Poster Presenter
Part of Topic
Original Research
Evaluation of finishing line trueness in digital impressions: a comparative study of two techniques
Priscila Ceolin Meneghetti*1, Paulo Borella2, Alia Oka Al Houch2, Rami Ammoun2, Awab A. Abdulmajeed2, Gustavo Mendonça2.
1Department of Restorative Sciences at the University of Alabama at Birmingham, School of Dentistry, Birmingham, USA; 2Department of General Practice, Virginia Commonwealth University, School of Dentistry, Richmond, USA.
INTRODUCTION
The new IOS Medit I7000 has a new feature that allows you to flip the mesh. Based on that, assessing deep margins with digital impressions is crucial for a suitable fitting of crowns.
OBJECTIVE
This in vitro study aimed to assess the trueness of the finishing line in digital impressions using two different techniques.
MATERIAL AND METHODS
Tooth #3 was prepared in a master model to receive a zirconia full crown. The finishing line was positioned 0.5 mm subgingival on the distal side to challenge the Intraoral Scanner System (IOS). The tooth was packed with a retraction cord.
Fig. 1| Digital scan showing the prep for #3 for zirconia crown with 0.5mm subgingival margin on distal.
Fig. 2| Digital scan showing the prep for #3 with the retraction cord.
CONTROL GROUP| Model scanned on a Bench scanner E4-3SHAPE (N=5)
TEST GROUP | conventional impression (PVS light material) + Digital Impression with Medit I700 IOS with finish lined erased + scanning the finishing line in the conven=onal impression (n=5)
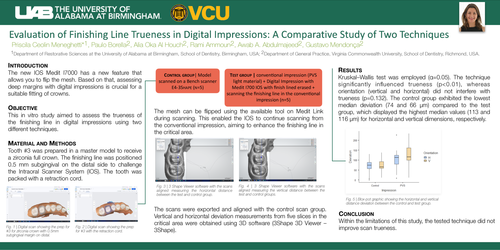
The mesh can be flipped using the available tool on Medit Link during scanning. This enabled the IOS to continue scanning from the conventional impression, aiming to enhance the finishing line in the critical area.
Fig. 3| 3 Shape Viewer software with the scans aligned measuring the horizontal distance between the test and control group.
Fig. 4| 3 Shape Viewer software with the scans aligned measuring the vertical distance between the test and control groups.
The scans were exported and aligned with the control scan group. Vertical and horizontal deviation measurements from five slices in the critical area were obtained using 3D software (3Shape 3D Viewer – 3Shape).
RESULTS
Kruskal–Wallis test was employed (α=0.05). The technique significantly influenced trueness (p<0.01), whereas orientation (vertical and horizontal) did not interfere with trueness (p=0.132). The control group exhibited the lowest median deviation (74 and 66 μm) compared to the test group, which displayed the highest median values (113 and 116 μm) for horizontal and vertical dimensions, respectively.
Fig. 5| Blox-pot graphic showing the horizontal and vertical distance deviation between the control and test groups.
CONCLUSION
Within the limitations of this study, the tested technique did not improve scan trueness.