171 posters, 10 topics, 5 sessions, 690 authors, 211 institutions
ePostersLive by SciGen Technologies S.A. All rights reserved.
American Association of Plastic Surgeons Meeting 2022
April 9 - 12 | San Diego, California

P34
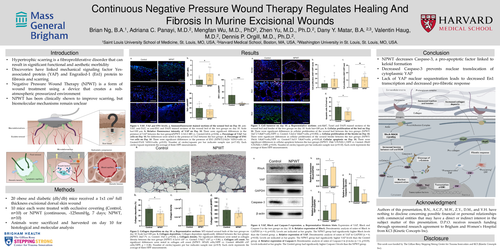
Continuous Negative Pressure Wound Therapy Regulates Healing And Fibrosis In Murine Excisional Wounds
Poster Presenter
Part of Topic
Basic Science Research
Continuous Negative Pressure Wound Therapy Regulates Healing And
Fibrosis In Murine Excisional Wounds
Brian Ng, B.A.1, Adriana C. Panayi, M.D.2, Mengfan Wu, M.D., PhD2, Zhen Yu, M.D., Ph.D.2, Dany Y. Matar, B.A. 2,3, Valentin Haug,
M.D.2, Dennis P. Orgill, M.D., Ph.D.2.
1Saint Louis University School of Medicine, St. Louis, MO, USA, 2Harvard Medical School, Boston, MA, USA, 3Washington University in St. Louis, St. Louis, MO, USA.
Introduction Results Conclusion
Methods
• Hypertrophic scarring is a fibroproliferative disorder that can
result in significant functional and aesthetic morbidity
• Discoveries have linked mechanical signaling factor Yesassociated
protein (YAP) and Engrailed-1 (En1) protein to
fibrosis and scarring
• Negative Pressure Wound Therapy (NPWT) is a form of
wound treatment using a device that creates a subatmospheric
pressurized environment
• NPWT has been clinically shown to improve scarring, but
biomolecular mechanisms remain unclear
• 20 obese and diabetic (db/db) mice received a 1x1 cm2 full
thickness excisional dorsal skin wound
• 10 mice each were treated with occlusive covering (Control,
n=10) or NPWT (continuous, -125mmHg, 7 days; NPWT,
n=10)
• Animals were sacrificed and harvested on day 10 for
histological and molecular analysis
• NPWT decreases Caspase-3, a pro-apoptotic factor linked to
keloid formation
• Decreased Caspase-3 prevents nuclear translocation of
cytoplasmic YAP
• Lack of YAP nuclear sequestration leads to decreased En1
transcription and decreased pro-fibrotic response
Figure 1. YAP, TAZ and EN1 levels. a. Immunofluorescent stained sections of the wound bed on Day 10. anti-
YAP, anti-TAZ, or anti-EN1 and DAPI stained sections of the wound bed of the two groups on day 10. Scale
bar=100 μm. b. Relative fluorescence intensity of YAP on Day 10. There were significant differences in the
presence of YAP between the two groups(NPWT: 2.3±1.3 RFI vs. Control:1±0.6; p=0.04). c. Percentage of TAZ +ve
cells on Day 10. No differences were noted in the presence of TAZ between the two groups. d. Percentage of EN1
+ve cells on Day 10. There were significant differences in the presence of EN1 (NPWT:2.8±2.6 %EN1+cells vs.
Control:37±32 %EN1+cells; p=0.01). Number of circles/squares per bar indicates sample size (n=7-10). Each
circles/square represents the average of three HPF measurements.
Figure 2. Collagen deposition on day 10. a. Representative sections. MT-stained wound beds of the two groups on
day 10. Scale bar=100 μm. b. Collagen deposition. Collagen deposition significantly differed between the two groups
(NPWT: 24±7.7% vs. Control: 33±7.1; p=0.02). c. Collagen density. No significant differences were noted in collagen
density between the two groups (NPWT: 6.1±3.6 x10⁷ vs. Control: 5.9±2.7 x10⁷; p = 0.86). c. Collagen cell count. No
significant differences were noted in collagen cell count (NPWT: 387±91 cells/HPF vs. Control: 480±208 x107
cells/HPF; p = 0.26). Number of circles/squares per bar indicates sample size (n=8-9). Each circle represents the
average of three HPF measurements.
Figure 3. Cell turnover on day 10. a. Representative sections. anti-Ki67, Tunel and DAPI stained sections of the
wound bed and border of the two groups on day 10. Scale bar=100 μm. b. Cellular proliferation of the bed on Day
10. There were significant differences in cellular proliferation of the wound bed between the two groups (NPWT:
14±7.2 %Ki67+cells/HPF vs. Control: 5.2±2.4 %Ki67+cells; p=0.002). c. Cellular proliferation of the border on Day 10.
There were significant differences in cellular proliferation of the wound border between the two groups (NPWT:
19±14 %Ki67+cells/HPF vs. Control:7.3±3.5 %Ki67+cells; p=0.03).d. Cellular apoptosis on Day 10. There were
significant differences in cellular apoptosis between the two groups (NPWT: 19±6 %TUNEL+/HPF vs. Control: 29±10
%TUNEL+/HPF; p=0.03). Number of circles/squares per bar indicates sample size (n=8-10). Each circle represents the
average of three HPF measurements.
Figure 4. YAP, RhoA and Caspase-3 expression. a. Representative Western blots. Expression of YAP, RhoA and
Caspase-3 in the two groups on day 10. b. Relative expression of RhoA. Densitometric analysis of ratios of RhoA to
GAPDH (n = 6; p=0.03). Levels are indicated as bar graphs. The NPWT group had significantly higher RhoA levels
than the Control group. c. Relative expression of YAP. Densitometric analysis of ratios of YAP to GAPDH (n = 6;
p=0.02). Levels are indicated as bar graphs. The NPWT group had significantly higher YAP levels than the Control
group. d. Relative expression of Caspase-3. Densitometric analysis of ratios of Caspase-3 to β-Actin (n = 6; p=0.03).
Levels indicated as bar graphs. The Control group had significantly higher Caspase-3 levels than the NPWT group.
Acknowledgment
Disclosure
Authors of this presentation, B.N., A.C.P., M.W., Z.Y., D.M., and V.H. have
nothing to disclose concerning possible financial or personal relationships
with commercial entities that may have a direct or indirect interest in the
subject matter of this presentation. D.P.O. receives research funding
through sponsored research agreement to Brigham and Women’s Hospital
from KCI (Kinetic Concepts Inc).
This work was funded by The Gillian Reny Stepping Strong Center for Trauma Innovation and KCI (Kinetic Concepts
Inc).