1,267 posters, 47 videos, 13 topics, 4 sessions, 853 authors
ePostersLive by SciGen Technologies S.A. All rights reserved.
SOHO 2026 Annual Meeting
September 9 - 12, 2026 | George R. Brown Convention Center, Houston, Texas

CT - 1586
The Goldilocks Zone of Adiposity: A Restricted Cubic Spline Meta-Analysis of Continuous BMI and the Non-Linear Risk of Severe CRS and ICANS in CAR-T Cell Therapy
Poster Presenter
Authors
Part of Topic
Cellular Therapy (CT)
The Goldilocks Zone of Adiposity: A Restricted Cubic Spline Meta-Analysis of Continuous BMI and the Non-Linear Risk of Severe CRS and ICANS in CAR-T Cell Therapy
Background
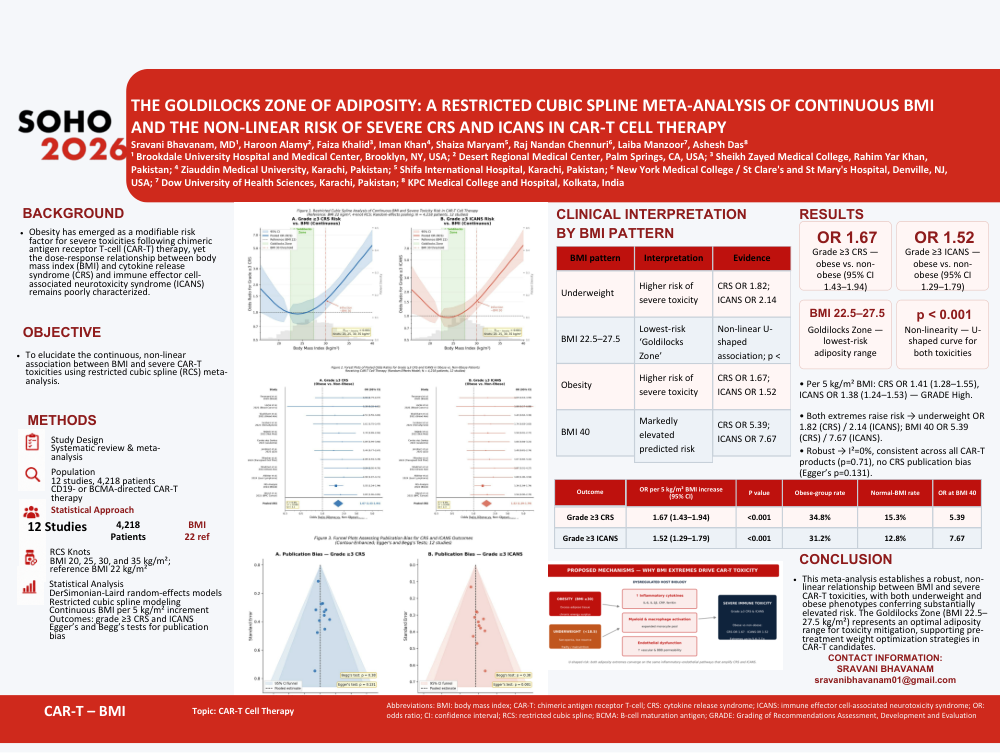
Obesity has emerged as a modifiable risk factor for severe toxicities following chimeric antigen receptor T-cell (CAR-T) therapy, yet the dose-response relationship between body mass index (BMI) and cytokine release syndrome (CRS) and immune effector cell-associated neurotoxicity syndrome (ICANS) remains poorly characterized. We performed a comprehensive meta-analysis incorporating restricted cubic spline (RCS) modeling to elucidate the continuous, non-linear association between BMI and severe CAR-T toxicities.
Methods
We systematically analyzed 12 studies encompassing 4,218 patients treated with CD19- or BCMA-directed CAR-T therapy. Categorical meta-analysis compared obese (BMI ≥30 kg/m²) versus non-obese patients using DerSimonian-Laird random-effects models. Continuous BMI associations were assessed per 5 kg/m² increment. RCS analysis with four knots (BMI 20, 25, 30, 35 kg/m²) modeled non-linear relationships, with BMI 22 kg/m² as reference. Outcomes included grade ≥3 CRS and ICANS. Publication bias was evaluated using Egger's and Begg's tests.
Results
Categorical analysis demonstrated obesity significantly increased risk of grade ≥3 CRS (OR 1.67, 95% CI 1.43–1.94, I²=0%, p<0.001) and ICANS (OR 1.52, 95% CI 1.29–1.79, I²=0%, p<0.001). Each 5 kg/m² BMI increment conferred OR 1.41 (95% CI 1.28–1.55) for CRS and OR 1.38 (95% CI 1.24–1.53) for ICANS (GRADE: High certainty). RCS modeling revealed striking U-shaped curves (p for non-linearity <0.001), identifying a "Goldilocks Zone" at BMI 22.5–27.5 kg/m² with minimal toxicity risk. Underweight patients (BMI <18.5 kg/m²) exhibited elevated risk (OR 1.82 for CRS, OR 2.14 for ICANS). Risk accelerated beyond BMI 30 kg/m², reaching OR 5.39 for CRS and OR 7.67 for ICANS at BMI 40 kg/m². Event rates ranged from 15.3% (CRS) and 12.8% (ICANS) in normal-weight patients to 34.8% and 31.2% in obese patients. Findings remained consistent across all CAR-T products (p for interaction=0.71). No publication bias was detected (Egger's p=0.131).
Conclusion
This meta-analysis establishes a robust, non-linear relationship between BMI and severe CAR-T toxicities, with both underweight and obese phenotypes conferring substantially elevated risk. The identified Goldilocks Zone (BMI 22.5–27.5 kg/m²) represents an optimal adiposity range for toxicity mitigation, supporting pre-treatment weight optimization strategies in CAR-T candidates.