816 posters, 24 topics, 3,314 authors, 1,012 institutions
ePostersLive by SciGen Technologies S.A. All rights reserved.
SAGES 2026 Annual Meeting Emerging Technology Session
March 25-28, 2026 | Tampa, FL, USA

P360
Comparing the Nassar and Parkland Scales in Laparoscopic Cholecystectomies: An Observational Study for Predicting Surgical Difficulty
Poster Presenter
Authors
Affiliations
Part of Topic
Biliary
introduction
Currently, the Parkland Grading Scale is the most widely used tool for intraoperative assessment of gallbladder disease severity, evaluating factors such as adhesion levels, gallbladder distension, and anatomical abnormalities in the initial evaluation of laparoscopic cholecystectomies. However, addressing only the initial view of the gallbladder omits analysis of the hepatocystic triangle, where the cystic structures necessary for the procedure are located. A difficult dissection of this area increases the risk of bile duct injury.
The Nassar Scale integrates criteria subsequent to the initial vision, allowing for the evaluation of intervisceral adhesions and the characteristics of the hepatocystic triangle, which better relates to the technical difficulty in obtaining the critical safety vision.
It is suggested that the Nassar score will exhibit a statistically higher correlation with surgical difficulty compared to the Parkland score. This is based on the fact that it provides a more comprehensive evaluation, considering anatomical and technical aspects of the hepatocystic triangle.
material and methods
Videos of laparoscopic cholecystectomies performed at our hospital were collected. The videos were viewed, pausing at the point where a wide view of the gallbladder was obtained. At that point, the corresponding grade was recorded according to the Parkland grading scale. Subsequently, once the hepatocystic triangle was identified, the highest grade that met the Nassar grading scale criteria was determined and recorded.
To record clipping time, the time indicated by the video display at the time the first clip was placed over the cystic artery or cystic duct was recorded.
Qualitative variables, such as the scores on both scales, were described using frequencies and percentages. An association between the two scales was then performed using Kendall's Tau C analysis.
To identify differences between variables and times, the Kruskall-Wallis test was performed, and a Theil-Sen regression model was used because the samples were non-parametric.
results
Thirty surgical videos were classified using both the Nassar and Parkland scales. The Nassar classification was distributed as follows: grade 2 (43.3%), grade 3 (36.7%), and grade 4/5 (20%). Regarding the Parkland classification, the following percentages were observed: grade 2 (40%), grade 3 (26.7%), grade 4 (13.3%), and grade 5 (20%). The average clipping time of the structures was 47 minutes (standard deviation = 24.4), while the total surgical time averaged 96 minutes (standard deviation = 33.9).
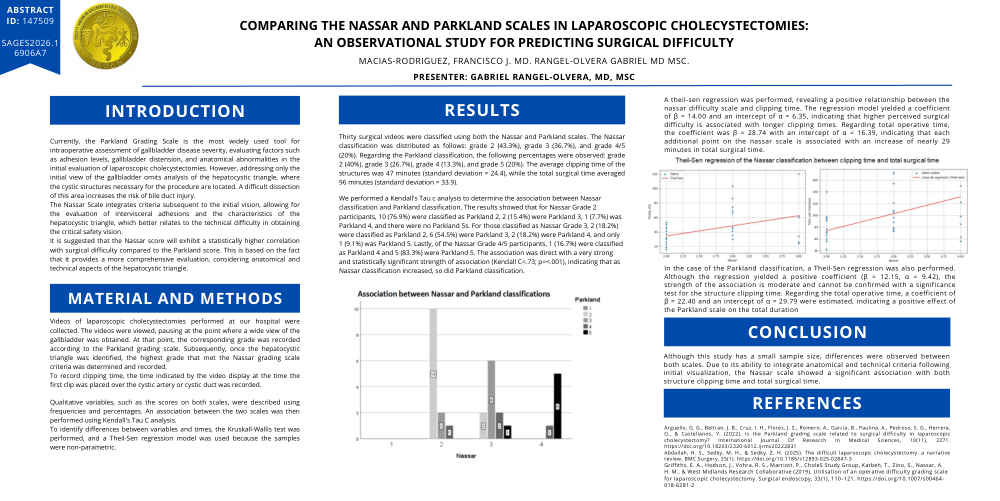
We performed a Kendall's Tau c analysis to determine the association between Nassar classification and Parkland classification. The results showed that for Nassar Grade 2 participants, 10 (76.9%) were classified as Parkland 2, 2 (15.4%) were Parkland 3, 1 (7.7%) was Parkland 4, and there were no Parkland 5s. For those classified as Nassar Grade 3, 2 (18.2%) were classified as Parkland 2, 6 (54.5%) were Parkland 3, 2 (18.2%) were Parkland 4, and only 1 (9.1%) was Parkland 5. Lastly, of the Nassar Grade 4/5 participants, 1 (16.7%) were classified as Parkland 4 and 5 (83.3%) were Parkland 5. The association was direct with a very strong and statistically significant strength of association (Kendall C=.73; p=<.001), indicating that as Nassar classification increased, so did Parkland classification.
A theil-sen regression was performed, revealing a positive relationship between the nassar difficulty scale and clipping time. The regression model yielded a coefficient of β = 14.00 and an intercept of α = 6.35, indicating that higher perceived surgical difficulty is associated with longer clipping times. Regarding total operative time, the coefficient was β = 28.74 with an intercept of α = 16.39, indicating that each additional point on the nassar scale is associated with an increase of nearly 29 minutes in total surgical time.
In the case of the Parkland classification, a Theil-Sen regression was also performed. Although the regression yielded a positive coefficient (β = 12.15, α = 9.42), the strength of the association is moderate and cannot be confirmed with a significance test for the structure clipping time. Regarding the total operative time, a coefficient of β = 22.40 and an intercept of α = 29.79 were estimated, indicating a positive effect of the Parkland scale on the total duration
Conclusion
Although this study has a small sample size, differences were observed between both scales. Due to its ability to integrate anatomical and technical criteria following initial visualization, the Nassar scale showed a significant association with both structure clipping time and total surgical time.