1,830 posters, 67 videos, 75 audios, 29 topics, 22 sessions, 4,727 authors, 1,697 institutions
ePostersLive by SciGen Technologies S.A. All rights reserved.
RCOG World Congress 2023
June 12 - 14, 2023 | London, UK

EP.1491
USE OF ROBSON CLASSIFICATION TO ASSESS CAESAREAN SECTION RATE
Poster Presenter
Authors
Affiliations
Part of Topic
Labour Ward Management
USE OF ROBSON CLASSIFICATION TO ASSESS CAESAREAN SECTION RATE
Kamalathasan.P, Ratnasiri.UDP
The Castle Street Hospital for Women, Colombo
Introduction: There is an increasing trend in the Caesarean section (CS) rate worldwide; the CS rate has increased threefold between 1998 and 2016 in Sri Lanka1. The World Health Organization (WHO) has advised that CS rates should not be more than 15%. Robson’s 10-group classification (RTGC) is based on parameters such as parity, number of fetuses, fetal presentation, previous CS, the onset of labour and gestational age but, It does not include the indication for CS2. WHO has recommended RTGC to assess care at delivery and to optimize the CS rate3.
Objective: Aim to analyse CS rate by using RTGC.
Method: A retrospective analysis was done on all women in this cohort who gave birth during 6 months starting from September 2018.
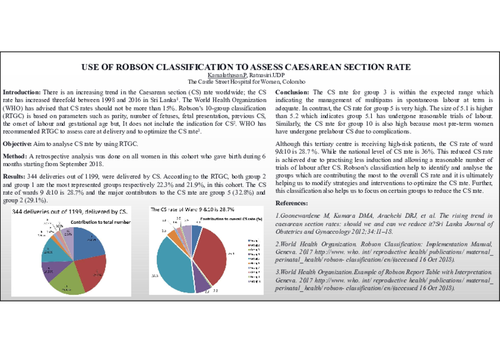
Results: 344 deliveries out of 1199, were delivered by CS. According to the RTGC, both group 2 and group 1 are the most represented groups respectively 22.3% and 21.9%, in this cohort. The CS rate of wards 9 &10 is 28.7% and the major contributors to the CS rate are group 5 (32.8%) and group 2 (29.1%).
Conclusion: The CS rate for group 3 is within the expected range which indicating the management of multiparas in spontaneous labour at term is adequate. In contrast, the CS rate for group 5 is very high. The size of 5.1 is higher than 5.2 which indicates group 5.1 has undergone reasonable trials of labour. Similarly, the CS rate for group 10 is also high because most pre-term women have undergone prelabour CS due to complications.
Although this tertiary centre is receiving high-risk patients, the CS rate of ward 9&10 is 28.7 %. While the national level of CS rate is 36%. This reduced CS rate is achieved due to practising less induction and allowing a reasonable number of trials of labour after CS. Robson’s classification help to identify and analyse the groups which are contributing the most to the overall CS rate and it is ultimately helping us to modify strategies and interventions to optimize the CS rate. Further, this classification also helps us to focus on certain groups to reduce the CS rate.
References:
1.Goonewardene M, Kumara DMA, Arachchi DRJ, et al. The rising trend in caesarean section rates: should we and can we reduce it?Sri Lanka Journal of Obstetrics and Gynaecology 2012;34:11–18.
2.World Health Organization. Robson Classification: Implementation Manual, Geneva. 2017 http://www. who. int/ reproductive health/ publications/ maternal_ perinatal_ health/ robson- classification/ en/(accessed 16 Oct 2018).
3.World Health Organization.Example of Robson Report Table with Interpretation. Geneva. 2017 http://www. who. int/ reproductive health/ publications/ maternal_ perinatal_ health/ robson- classification/ en/(accessed 16 Oct 2018).