58 posters, 14 topics, 4 sessions, 188 authors, 62 institutions
ePostersLive by SciGen Technologies S.A. All rights reserved.
PSRC 69th Annual Meeting 2024
May 16-19, 2024 | The Westin Copley Place, Boston, MA

EP43
Longitudinal Nerve And Muscle Changes In A Murine Model Of Chronic Nerve Compression
Poster Presenter
Authors
Affiliations
Part of Topic
Nerve
LONGITUDINAL NERVE AND MUSCLE CHANGES IN A MURINE MODEL OF CHRONIC NERVE COMPRESSION
Introduction
Results
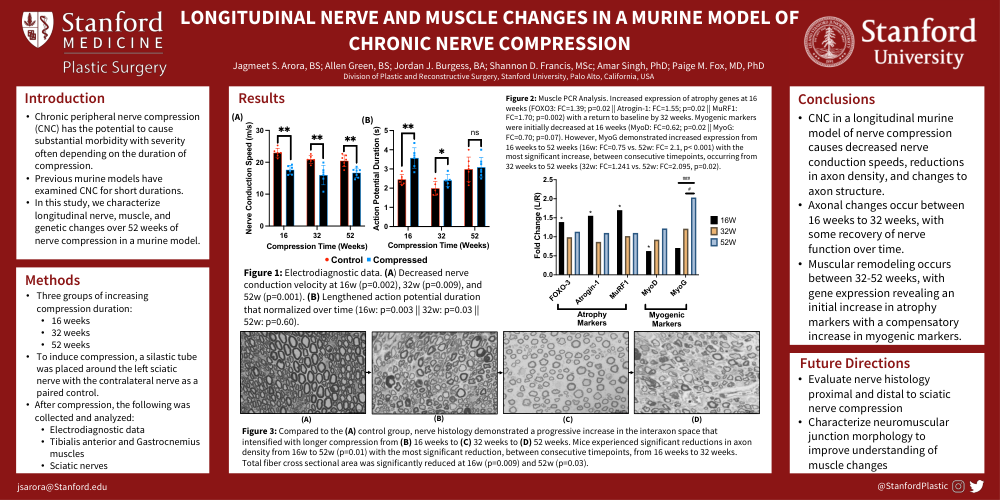
Figure 1: Electrodiagnostic data. (A) Decreased nerve conduction velocity at 16w (p=0.002), 32w (p=0.009), and 52w (p=0.001). (B) Lengthened action potential duration that normalized over time (16w: p=0.003 || 32w: p=0.03 || 52w: p=0.60).
Figure 2: Muscle PCR Analysis. Increased expression of atrophy genes at 16 weeks (FOXO3: FC=1.39; p=0.02 || Atrogin-1: FC=1.55; p=0.02 || MuRF1: FC=1.70; p=0.002) with a return to baseline by 32 weeks. Myogenic markers were initially decreased at 16 weeks (MyoD: FC=0.62; p=0.02 || MyoG: FC=0.70; p=0.07). However, MyoG demonstrated increased expression from 16 weeks to 52 weeks (16w: FC=0.75 vs. 52w: FC= 2.1, p< 0.001) with the most significant increase, between consecutive timepoints, occurring from 32 weeks to 52 weeks (32w: FC=1.241 vs. 52w: FC=2.095, p=0.02).
Figure 3: Compared to the (A) control group, nerve histology demonstrated a progressive increase in the interaxon space that intensified with longer compression from (B) 16 weeks to (C) 32 weeks to (D) 52 weeks. Mice experienced significant reductions in axon density from 16w to 52w (p=0.01) with the most significant reduction, between consecutive timepoints, from 16 weeks to 32 weeks. Total fiber cross sectional area was significantly reduced at 16w (p=0.009) and 52w (p=0.03).
Conclusions