586 posters, 8 topics, 23 sessions, 1,077 authors, 622 institutions
ePostersLive by SciGen Technologies S.A. All rights reserved.
ISQua's 40th International Conference 2024
24th - 27th September 2024 | Istanbul, Türkiye

P605
Evaluating the Performance of Front Desk Service Personnel at a Certain Medical Center Using DEA Model
Poster Presenter
Part of Topic
Workforce, Policy, and Governance
P605
Evaluating the Performance of Front Desk Service Personnel at a Certain Medical Center Using DEA Model
Meng-Hsun Lee 1, 2, Chih-Yuan Chu 2, Hung-Wen Tsai 1
1 Department of Medical Administration, Taichung Veterans General Hospital, Taichung City, Taiwan
2 Department of Industrial Engineering and Enterprise Information, Tunghai University, Taichung City, Taiwan
INTRODUCTION
Literature review highlights criticisms of performance evaluation systems for falling short of employee expectations. Utilizing Data Envelopment Analysis (DEA), we gauge employee performance and efficiency, addressing weaknesses in traditional evaluation systems and offering a comprehensive individual performance indicator.
Established in 1982, a prominent medical center in Taiwan boasts 1,600 beds, 6,000 employees, and handles over 9,000 outpatient visits daily. Since 2006, the medical center has employed a system for front desk service personnel evaluations.
This study compares its results with the DEA model and deriving specific recommendations from the findings.
AIM
The primary aim of this study is to assess the performance of front desk service personnel at a medical center using the DEA model.
This assessment includes evaluating total productivity changes over time, analyzing the correlation between the DEA model's efficiency rankings and the current performance evaluation system, and categorizing Decision Making Units (DMUs) based on their efficiency.
The study also aims to compare these results with the current performance evaluation system that has been in place for several years and propose recommendations for improvement based on the findings.
METHOD
The performance bonuses for employees at a certain medical center were disbursed based on a monthly time frame. Given the adjustment in the evaluation criteria after October 2023, this analysis focused on the period from April to September 2023. The analysis included 29 front desk personnel, for whom both input and output variables had complete numerical values, resulting in 29 Decision Making Units (DMUs) each month. This research employed the DEAP Version 2.1 program, provided by the Centre for Efficiency and Productivity Analysis at the University of Queensland, Australia, to calculate the DEA models for constant returns to scale (CRS) and variable returns to scale (VRS). Additionally, it explored the Malmquist Index to measure the total factor productivity (TFP).
The input variable was the number of hours worked per month. The output variables included the total points for "service performance" and "job contribution" for each personnel. The calculation of total points involved the sum of the weighted points for each evaluation criterion multiplied by the quantity or duration (Σ Weighted Points * Quantity or Duration = Total Points). Graphical representation and statistical analysis were conducted using Visual Studio Code (version 1.85) to write Python codes.
RESULTS
1.Malquist Index: The average value of TFP change over the six months was 1.005, indicating a slight increase in total productivity. Out of the 29 Decision Making Units (DMUs), 14 (48.3%) had values greater than 1, 1 DMU (3.4%) had a value equal to 1, and 11 DMUs (37.9%) had values ranging from 0.96 to 1. However, three DMUs experienced a more significant decrease in total productivity.
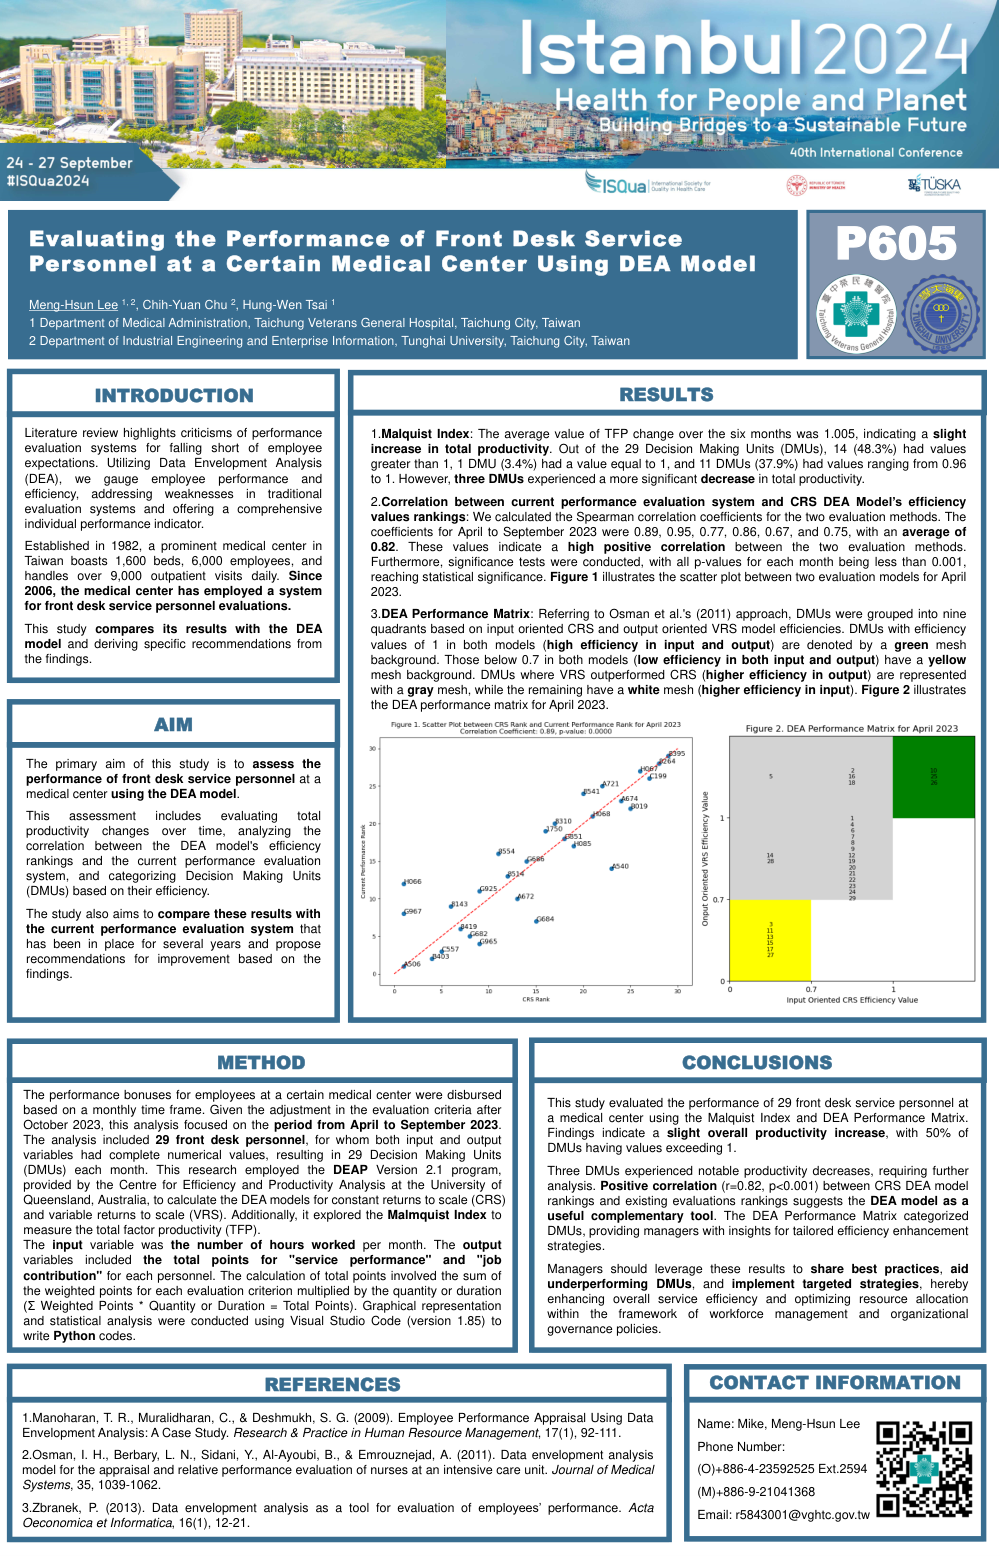
2.Correlation between current performance evaluation system and CRS DEA Model's efficiency values rankings: We calculated the Spearman correlation coefficients for the two evaluation methods. The coefficients for April to September 2023 were 0.89, 0.95, 0.77, 0.86, 0.67, and 0.75, with an average of 0.82. These values indicate a high positive correlation between the two evaluation methods. Furthermore, significance tests were conducted, with all p-values for each month being less than 0.001, reaching statistical significance. Figure 1 illustrates the scatter plot between two evaluation models for April 2023.
3.DEA Performance Matrix: Referring to Osman et al.'s (2011) approach, DMUs were grouped into nine quadrants based on input oriented CRS and output oriented VRS model efficiencies. DMUs with efficiency values of 1 in both models (high efficiency in input and output) are denoted by a green mesh background. Those below 0.7 in both models (low efficiency in both input and output) have a yellow mesh background. DMUs where VRS outperformed CRS (higher efficiency in output) are represented with a gray mesh, while the remaining have a white mesh (higher efficiency in input). Figure 2 illustrates the DEA performance matrix for April 2023.
CONCLUSIONS
This study evaluated the performance of 29 front desk service personnel at a medical center using the Malquist Index and DEA Performance Matrix. Findings indicate a slight overall productivity increase, with 50% of DMUs having values exceeding 1.
Three DMUs experienced notable productivity decreases, requiring further analysis. Positive correlation (r=0.82, p<0.001) between CRS DEA model rankings and existing evaluations rankings suggests the DEA model as a useful complementary tool. The DEA Performance Matrix categorized DMUs, providing managers with insights for tailored efficiency enhancement strategies.
Managers should leverage these results to share best practices, aid underperforming DMUs, and implement targeted strategies, hereby enhancing overall service efficiency and optimizing resource allocation within the framework of workforce management and organizational governance policies.
REFERENCES
1.Manoharan, T. R., Muralidharan, C., & Deshmukh, S. G. (2009). Employee Performance Appraisal Using Data Envelopment Analysis: A Case Study. Research & Practice in Human Resource Management, 17(1), 92-111.
2.Osman, I. H., Berbary, L. N., Sidani, Y., Al-Ayoubi, B., & Emrouznejad, A. (2011). Data envelopment analysis model for the appraisal and relative performance evaluation of nurses at an intensive care unit. Journal of Medical Systems, 35, 1039-1062.
3.Zbranek, P. (2013). Data envelopment analysis as a tool for evaluation of employees' performance. Acta Oeconomica et Informatica, 16(1), 12-21.
CONTACT INFORMATION
Name: Mike, Meng-Hsun Lee
Phone Number:
(O)+886-4-23592525 Ext.2594
(M)+886-9-21041368
Email: r5843001@vghtc.gov.tw