425 posters, 1 videos, 9 audios, 8 topics, 53 sessions, 340 authors, 286 institutions
ePostersLive by SciGen Technologies S.A. All rights reserved.
22nd Annual Pain Medicine Meeting 2023
November 10 - 11, 2023 | New Orleans Marriott | New Orleans, Louisiana, USA

4516
SELF-ISOLATION AND ITS IMPACT ON CHRONIC PAIN
Poster Presenter
Part of Topic
Chronic Pain
Self-isolation and Its Impact on Chronic Pain
Author Information: Trong Nguyen, M.D.*,Darryl Brown, M.D.*, Lauren Mathew, M.D.*, Aleksey Maryansky, D.O.*, Aham Okorozo**, Hung-Mo Lin Sc.D.**, Jung Kim, M.D.*
*Department of Anesthesiology, Perioperative and Pain Medicine,
Mount Sinai West and Mount Sinai Morningside Hospitals
New York, NY, USA
** Department of Population Health Science and Policy
Mount Sinai Hospital
New York, NY, USA
Introduction:
Early on in the coronavirus disease (COVID-19) pandemic, New York City was the epicenter in the United States. To reduce the spread of this highly contagious virus, a “shelter in place” order was initiated on March 20, 2020, which stopped all in-person visits at pain management clinics (1). This order continued until June 13, 2020. The aim of our study is to investigate the impact of this “shelter in place” order on pain severity and level of disability in patients with pre-existing chronic pain.
Methods:
1.Study design
This is an observational prospective cohort study that received approval from the Institutional Review Board (IRB) at the Mount Sinai Health System (New York, NY). The primary outcome was measured by the Brief Pain Inventory (BPI) questionnaire (2).
Image 1 - Brief Pain Inventory (BPI) questionnaire: sample question

2.Subjects
65 subjects participated in the study. The inclusion criteria were:
(1) adults older than 18 y.o.
(2) presence of chronic pain lasting longer than 3 months
(3) actively receiving treatment at Mount Sinai Pain Management and Wellness Center during the “shelter in place” order (03/20/2020 - 6/13/2020).
The exclusion criteria were patients who received any surgical or interventional treatment for pain during the study period.
3.Data analysis
This study divided patients into during-quarantine (3/20 - 6/13/2020) and post-quarantine periods. The patient pain ratings were classified into mild (≤ 3), moderate (4-6) and severe pain (≥ 7). The difference in pain ratings in the two periods were rated as “improved” if there was a negative difference (≤ -1), which means the post-quarantine pain rating is lower than the pre-quarantine pain rating; “same” if there was no difference (0); and “worse” if the post-quarantine pain rating was higher than the pre-quarantine pain rating (≥ 1). This same principle is applied to the functional scores as well, which were categorized as “improved” (< 0), “same” (0), and “worse” (> 0).
The Wilcoxon signed-rank test was used for continuous variables, and weighted kappa statistics were used for the categorical data. Statistical significance was defined as a p-value < 0.05.
Results:
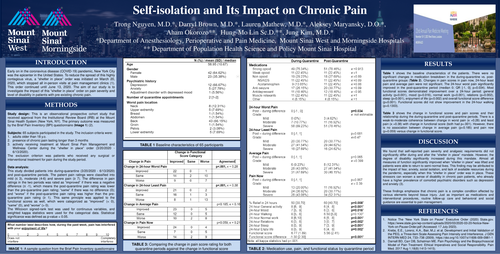
Table 1 shows the baseline characteristics of the patients. There were no significant changes in medication breakdown in the during-quarantine vs. post-quarantine groups (Table 2). Changes in pain scores in the pain now, 24-hour least pain and average pain were not significantly different as well. The 24-hour worst pain significantly improved in the post-quarantine period (median 0; QR [-1, 0]; p=0.034). Functional scores demonstrated improvement over a 24-hour period: General activity (p<0.001), mood (p=0.016), normal work (p<0.001), relations (p=0.002), sleep (p<0.001), enjoyment of life (p<0.002) and overall functional score difference (p<0.001). Functional scores did not show improvement in the 24-hour walking (p=0.1303).
Table 3 shows the change in functional scores and pain scores and their relationship during the during-quarantine and post-quarantine periods. There is a weak to moderate coherence between change in worst pain (κ =0.28) and least pain (κ =0.38) with change in functional score (both had p<.001). However, there is no association between change in average pain (p=0.185) and pain now (p=0.059) versus change in functional score.
Discussion:
We found that self-reported pain severity and analgesic requirements did not significantly differ during and after the “shelter in place” mandate. However, the degree of disability significantly increased during this mandate. Almost all measures of function significantly improved when “shelter in place” was lifted and patients were able to return to semi-normal lives. This finding may be attributed to the impact of fear, anxiety, social isolation, and lack of available resources during the pandemic, especially when this “shelter in place” order was in place. These stressors can worsen a sense of disability in chronic pain patients, who already have a higher prevalence of comorbid psychiatric disorders such as depression and anxiety (3).
These findings reemphasize that chronic pain is a complex condition affected by various elements beyond tissue injury. Just as important as medications and interventional procedures, routine follow-up care and behavioral and social guidance are essential to pain management.
TABLE 1: Baseline characteristics of 65 participants
|
N (%) / mean (SD) / median [IQR] |
||
|
Age |
58.95 (10.67) |
|
|
Gender |
||
|
Female |
42 (64.62%) |
|
|
Male |
23 (35.38%) |
|
|
Psychiatric history |
||
|
Depression |
12 (66.67%) |
|
|
Anxiety |
5 (27.78%) |
|
|
Adjustment disorder with depressed mood |
1 (5.56%) |
|
|
Number of quarantine appointments |
2 [1-2] |
|
|
Worst pain location |
||
|
Neck |
8 (12.31%) |
|
|
Upper extremity |
5 (7.69%) |
|
|
Breast |
1 (1.54%) |
|
|
Abdomen |
1 (1.54%) |
|
|
Back |
43 (66.15%) |
|
|
Groin |
1 (1.54%) |
|
|
Pelvis |
2 (3.08%) |
|
|
Lower extremity |
5 (7.69%) |
|
TABLE 2: Medication use, pain and functional status, by quarantine period
|
During-Quarantine |
Post-Quarantine |
||
|
Medications |
|||
|
Strong opioid |
49 (75.34%) |
51 (78.46%) |
κ =0.913 |
|
Weak opioid |
11 (22.45%) |
11 (22.45%) |
κ =1 |
|
Non opioid |
19 (29.23%) |
18 (27.69%) |
κ =0.89 |
|
NSAIDS |
11 (22.45%) |
11 (22.45%) |
κ =0.89 |
|
Acetaminophen |
9 (13.85%) |
11 (22.45%) |
κ =0.88 |
|
Anti-seizure |
17 (26.15%) |
20 (30.77%) |
κ =0.89 |
|
Antidepressant |
11 (18.46%) |
12 (18.46%) |
κ =0.95 |
|
Muscle relaxants |
11 (22.45%) |
11 (22.45%) |
κ =1 |
|
Other |
4 (6.15%) |
4 (6.15%) |
κ =1 |
24-hour Worst Pain |
|||
|
Post – during difference |
0 [-1 , 0] |
p=0.034 |
|
|
Grade: |
κ not estimable |
||
|
Mild |
0 (0%) |
3 (4.62%) |
|
|
Moderate |
7 (10.77%) |
11 (16.92%) |
|
|
Severe |
58 (89.23%) |
51 (78.46%) |
|
|
24-hour Least Pain |
|||
|
Post – during difference |
0 [-1, 1] |
p=0.681 |
|
|
Grade: |
κ=0.47 |
||
|
Mild |
20 (30.77%) |
20 (30.77%) |
|
|
Moderate |
27 (41.54%) |
29 (44.62%) |
|
|
Severe |
18 (27.69%) |
16 (24.62%) |
|
|
Average Pain |
|||
|
Post – during difference |
0 [-1, 1] |
p=0.065 |
|
|
Grade: |
κ =0.399 |
||
|
Mild |
6 (9.23%) |
8 (12.31%) |
|
|
Moderate |
28 (43.08%) |
27 (41.54%) |
|
|
Severe |
31 (47.69%) |
30 (46.15%) |
|
|
Pain Now |
|||
|
Post – during difference |
0 [-1, 1] |
p=0.867 |
|
|
Grade: |
κ = 0.39 |
||
|
Mild |
13 (20.00%) |
11 (16.92%) |
|
|
Moderate |
24 (36.92%) |
20 (30.77%) |
|
|
Severe |
28 (43.08%) |
34 (52.31%) |
|
|
% Relief in 24 hours |
50 [30,70] |
60 [40,70] |
p=0.0081 |
|
24-hour General activity |
8 [6, 9] |
6 [4, 8] |
p<0.0011 |
|
24-hour Mood |
7 [5, 9] |
6 [3, 8] |
p=0.0161 |
|
24-hour Walking |
8 [5, 8] |
6.50 [5,8] |
p=0.1301 |
|
24-hour Normal work |
8 [6,10] |
6 [5, 8] |
p<0.0011 |
|
24-hour Relations |
6 [3, 8] |
3 [0, 7] |
p=0.0021 |
|
24-hour Sleep |
8 [5, 9] |
7 [3, 9] |
p<0.0011 |
|
24-hour Enjoy life |
8 [5, 9] |
6 [4, 8] |
p=0.0021 |
|
Functional score |
6.77 (1.89) |
5.56 (2.41) |
|
|
Functional score difference |
-1.30 [2.30] |
p<0.0011 |
|
Note: all kappa statistics had p<.001.
TABLE 3: Comparing the change in pain score rating for both quarantine periods against change in functional score.
|
Change in Functional Score Category |
||||
|
Change in Pain |
Improved |
Same |
Worse |
Agreement |
|
Change in 24-hour Worst Pain |
p<.001, κ = 0.28 |
|||
|
Improved |
22 |
0 |
1 |
|
|
Same |
14 |
2 |
10 |
|
|
Worse |
9 |
0 |
7 |
|
|
Change in 24-hour Least Pain |
p<.001, κ = 0.38 |
|||
|
Improved |
21 |
0 |
2 |
|
|
Same |
16 |
1 |
3 |
|
|
Worse |
8 |
1 |
13 |
|
|
Change in Average Pain |
p=0.185, κ = 0.16 |
|||
|
Improved |
23 |
0 |
5 |
|
|
Same |
12 |
0 |
5 |
|
|
Worse |
10 |
2 |
8 |
|
|
Change in Pain Now |
p=0.059, κ = 0.21 |
|||
|
Improved |
24 |
0 |
4 |
|
|
Same |
7 |
0 |
5 |
|
|
Worse |
14 |
2 |
9 |
|
References:
-
Notice The “New York State on Pause” Executive Order (2020) State.gov. https://www.state.gov/wp-content/uploads/2020/03/2020-03-20-Notice-New-York-on-Pause-Order.pdf (Accessed: 17 July 2023).
-
Krebs, E.E., Lorenz, K.A., Bair, M.J. et al. Development and Initial Validation of the PEG, a Three-item Scale Assessing Pain Intensity and Interference. J GEN INTERN MED 24, 733–738 (2009). https://doi.org/10.1007/s11606-009-0981-1
-
Darnall BD, Carr DB, Schatman ME. Pain Psychology and the Biopsychosocial Model of Pain Treatment: Ethical Imperatives and Social Responsibility. Pain Med. 2017 Aug 1;18(8):1413-1415).