4,068 posters, 219 videos, 101 topics, 69 sessions, 14,365 authors, 6,128 institutions
ePostersLive by SciGen Technologies S.A. All rights reserved.
Alzheimer's Association International Conference 2026
July 12-15, 2026 | London, United Kingdom, and Online

10383
Longitudinal Relationship Between Depression And Hippocampal Subfield Volumes In Cognitively Unimpaired Older Adults
Poster Presenter
Authors
Danielle Luu, Victoria Tennant, Marylan Davison, Patrick Walsh, Rajesh Nandy, Arthur Toga, Sid O'Bryant, Kristine Yaffe, Meredith Braskie
Affiliations
Mark and Mary Stevens Neuroimaging and Informatics Institute, Keck School of Medicine, University of Southern California, Los Angeles, CA, USA, University of North Texas Health Science Center, Fort Worth, TX, 76107, USA, University of California, San Francisco, Weill Institute for Neurosciences, San Francisco, CA, 94121, USA
Part of Topic
Longitudinal relationship between depression and hippocampal subfield volumes in cognitively unimpaired older adults
Danielle Luu1, Victoria Tennant1, Marylan Davison, MS1, Patrick Walsh, MS1, Rajesh Nandy, PhD2, Arthur W. Toga, PhD1, Sid O’Bryant, PhD2, Kristine Yaffe, MD3, Meredith N. Braskie, PhD1
(1) Mark and Mary Stevens Neuroimaging and Informatics Institute, Keck School of Medicine, University of Southern California, Los Angeles, CA, USA, (2) University of North Texas Health Science Center, Fort Worth, TX, 76107, USA, (3) University of California, San Francisco, Weill Institute for Neurosciences, San Francisco, CA, 94121, USA
Introduction:
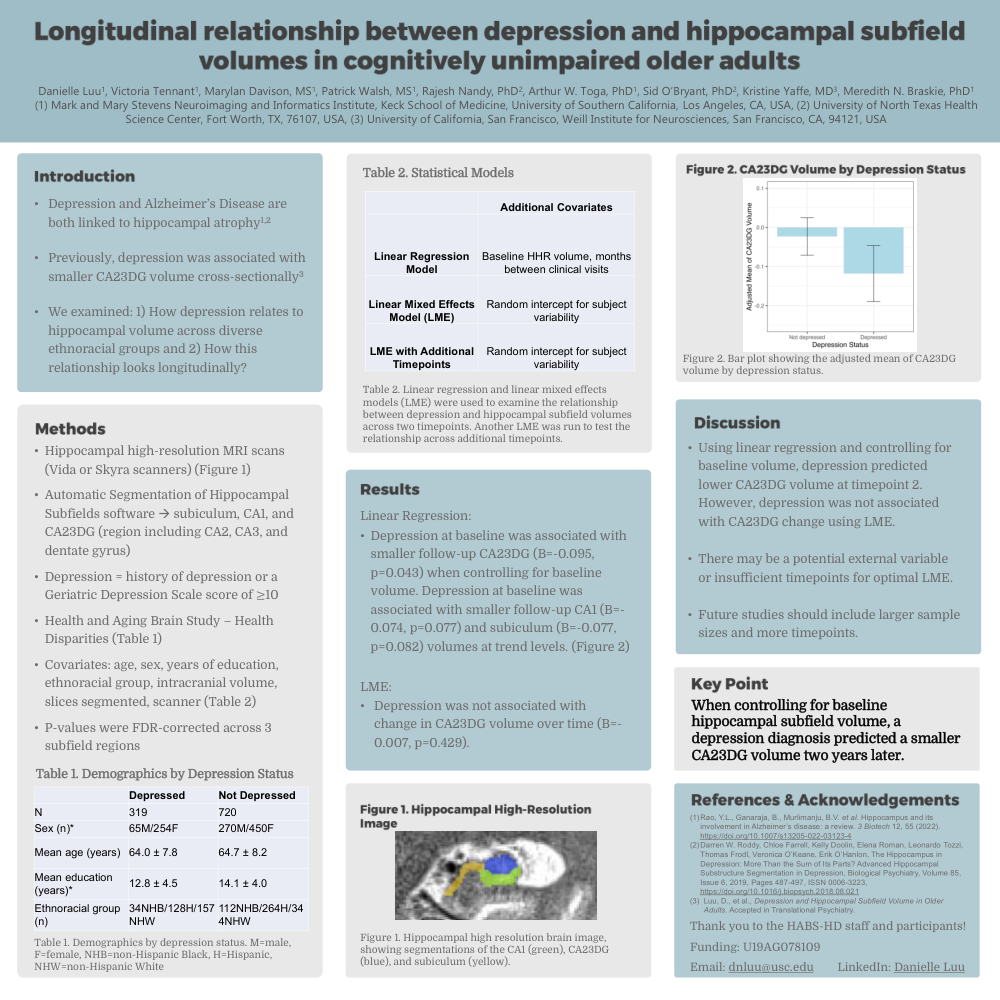
Linear Regression:
LME:
•There may be a potential external variable or insufficient timepoints for optimal LME.
When controlling for baseline hippocampal subfield volume, a depression diagnosis predicted a smaller CA23DG volume two years later.
Comments
Email is required but is not shown publicly.
Loading comments...