4,068 posters, 219 videos, 101 topics, 69 sessions, 14,365 authors, 6,128 institutions
ePostersLive by SciGen Technologies S.A. All rights reserved.
Alzheimer's Association International Conference 2026
July 12-15, 2026 | London, United Kingdom, and Online

7143
Correlations Between Plasma Irisin And Dementia Biomarkers In A Brazilian Cohort
Poster Presenter
Authors
Alice Saldanha, Guilherme Freitas, Felipe Sudo, Carlos Otavio Brandão, Bart Vanderborght, Mychael Lourenco, Paulo Mattos, Fernanda Tovar-Moll, Luis Eduardo Santos, Fernanda De Felice
Affiliations
D'Or Institute for Research and Education, Brazil, Queens University, Canada, Federal University of Rio de Janeiro, Brazil, D'Or Institute for Research and Education, Brazil and Queens University, Canada
Part of Topic
Correlations between plasma irisin and dementia biomarkers in a Brazilian cohort
Saldanha, A. ¹ , Freitas, G.² , Sudo, FK. ¹, Brandão, CO. ¹, Vanderborght, B. ¹, Lourenco, MV.³, Tovar-Moll, F. ¹, Mattos, P. ¹, Santos, LE. ¹ and De Felice, FG ¹’².
1. D'Or Institute for Research and Education, Brazil 2. Queens University, Canada 3. Federal University of Rio de Janeiro, Brazil
Introduction
Methods
Participants and ethics
Approved by the IDOR Ethics Committee. All participants provided written consent. From 300 recruited at IDOR’s Memory Clinic (Rio de Janeiro, Brazil), 242 with available plasma and biomarker data were classified as cognitively unimpaired (CU) or impaired (aMCI/AD).
Plasma biomarkers
Blood (3 mL, EDTA) was processed within 2 h, stored at −80 °C, and analyzed on the SIMOA HD-X platform (Quanterix) using Neurology 3-Plex A, pTau181, and pTau217 kits. Assays included calibrators, controls, and local QC (CV < 10%).
Statistics
Data were collected in REDCap and analyzed in RStudio. Sample size was determined by biomarker availability.
Results
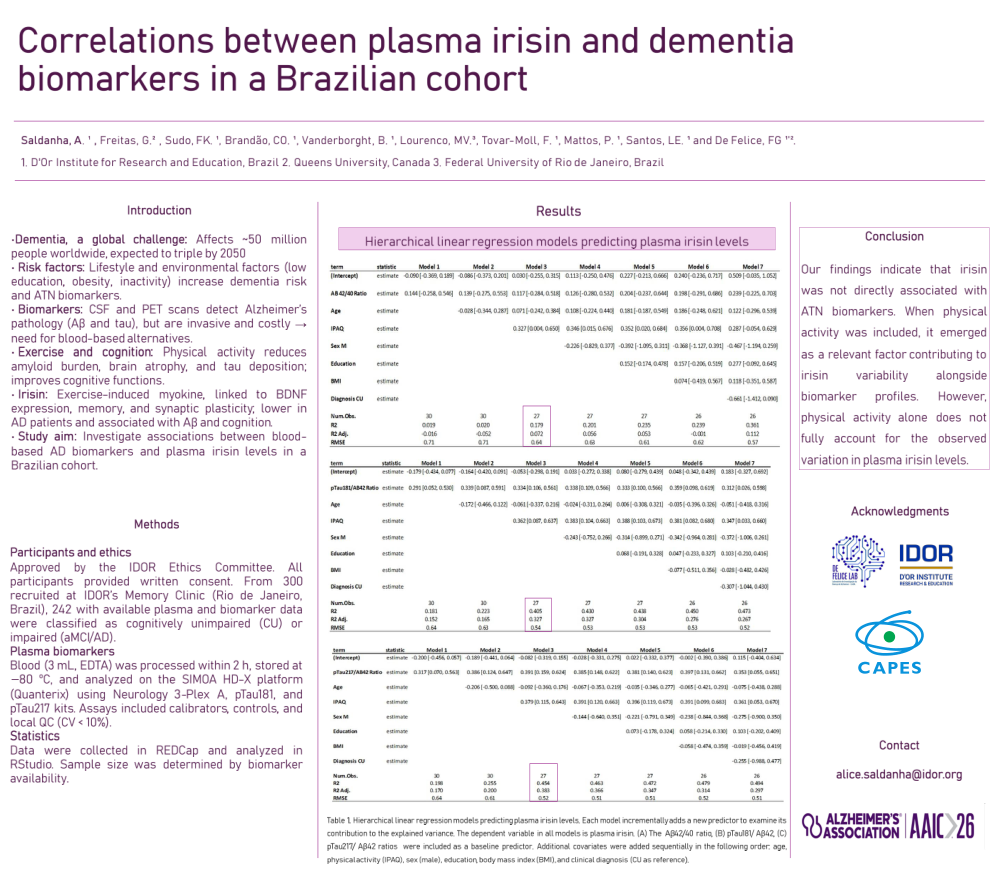
Hierarchical linear regression models predicting plasma irisin levels
Table 1. Hierarchical linear regression models predicting plasma irisin levels. Each model incrementally adds a new predictor to examine its contribution to the explained variance. The dependent variable in all models is plasma irisin. (A) The Aβ42/40 ratio, (B) pTau181/ Aβ42, (C) pTau217/ Aβ42 ratios were included as a baseline predictor. Additional covariates were added sequentially in the following order: age, physical activity (IPAQ), sex (male), education, body mass index (BMI), and clinical diagnosis (CU as reference).
Conclusion
Our findings indicate that irisin was not directly associated with ATN biomarkers. When physical activity was included, it emerged as a relevant factor contributing to irisin variability alongside biomarker profiles. However, physical activity alone does not fully account for the observed variation in plasma irisin levels.
Comments
Email is required but is not shown publicly.
Loading comments...