4,068 posters, 219 videos, 101 topics, 69 sessions, 14,365 authors, 6,128 institutions
ePostersLive by SciGen Technologies S.A. All rights reserved.
Alzheimer's Association International Conference 2026
July 12-15, 2026 | London, United Kingdom, and Online

7088
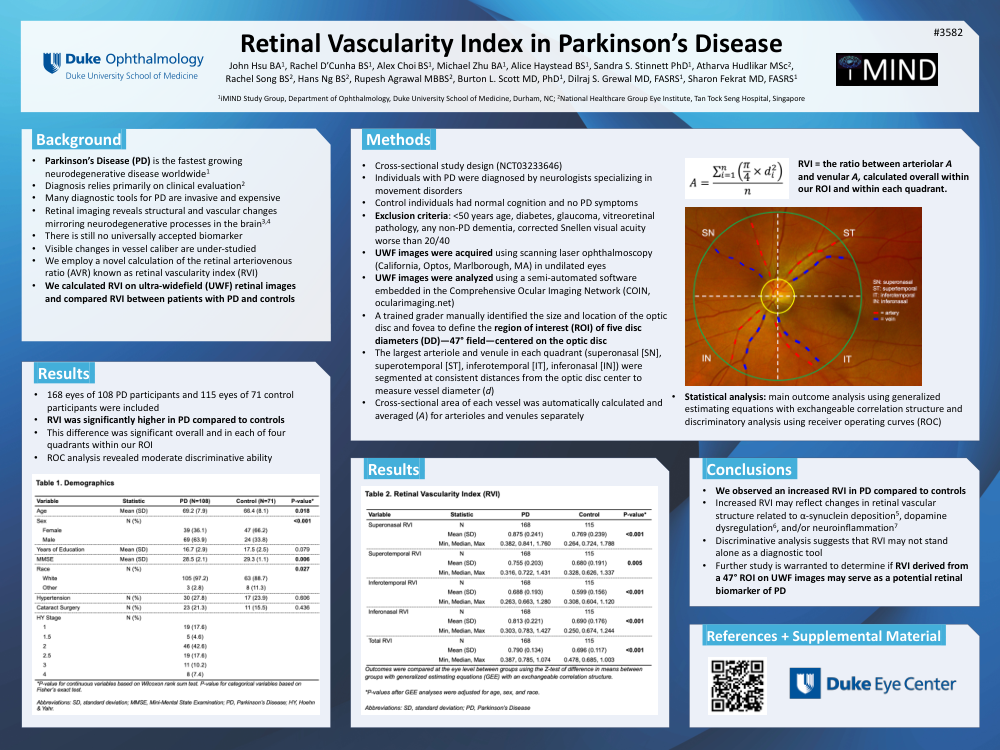
Retinal Vascularity Index In Parkinson's Disease Vs Controls
Poster Presenter
Part of Topic
Parkinson’s Disease (PD) is the fastest growing
neurodegenerative disease worldwide1
• Diagnosis relies primarily on clinical evaluation2
• Many diagnostic tools for PD are invasive and expensive
• Retinal imaging reveals structural and vascular changes
mirroring neurodegenerative processes in the brain3,4
• There is still no universally accepted biomarker
• Visible changes in vessel caliber are under-studied
• We employ a novel calculation of the retinal arteriovenous
ratio (AVR) known as retinal vascularity index (RVI)
• We calculated RVI on ultra-widefield (UWF) retinal images
and compared RVI between patients with PD and controls
Methods
Cross-sectional study design (NCT03233646)
• Individuals with PD were diagnosed by neurologists specializing in
movement disorders
• Control individuals had normal cognition and no PD symptoms
• Exclusion criteria: <50 years age, diabetes, glaucoma, vitreoretinal
pathology, any non-PD dementia, corrected Snellen visual acuity
worse than 20/40
• UWF images were acquired using scanning laser ophthalmoscopy
(California, Optos, Marlborough, MA) in undilated eyes
• UWF images were analyzed using a semi-automated software
embedded in the Comprehensive Ocular Imaging Network (COIN,
ocularimaging.net)
• A trained grader manually identified the size and location of the optic
disc and fovea to define the region of interest (ROI) of five disc
diameters (DD)—47° field—centered on the optic disc
• The largest arteriole and venule in each quadrant (superonasal [SN],
superotemporal [ST], inferotemporal [IT], inferonasal [IN]) were
segmented at consistent distances from the optic disc center to
measure vessel diameter (d)
• Cross-sectional area of each vessel was automatically calculated and
averaged (A) for arterioles and venules separately
RVI = the ratio between arteriolar A
and venular A, calculated overall within
our ROI and within each quadrant.
• Statistical analysis: main outcome analysis using generalized
estimating equations with exchangeable correlation structure and
discriminatory analysis using receiver operating curves (ROC)
Results
168 eyes of 108 PD participants and 115 eyes of 71 control
participants were included
• RVI was significantly higher in PD compared to controls
• This difference was significant overall and in each of four
quadrants within our ROI
• ROC analysis revealed moderate discriminative ability
Conclusions
We observed an increased RVI in PD compared to controls
• Increased RVI may reflect changes in retinal vascular
structure related to α-synuclein deposition5, dopamine
dysregulation6, and/or neuroinflammation7
• Discriminative analysis suggests that RVI may not stand
alone as a diagnostic tool
• Further study is warranted to determine if RVI derived from
a 47° ROI on UWF images may serve as a potential retinal
biomarker of PD
Comments
Email is required but is not shown publicly.
Loading comments...