4,068 posters, 219 videos, 101 topics, 69 sessions, 14,365 authors, 6,128 institutions
ePostersLive by SciGen Technologies S.A. All rights reserved.
Alzheimer's Association International Conference 2026
July 12-15, 2026 | London, United Kingdom, and Online

2829
Predictive Models For Alzheimer’s Disease Pathology Risk: Participant - Informant Reported ECog-12 Scores And Discrepancy
Poster Presenter
Authors
Part of Topic
Predictive Models for Alzheimer's Disease Pathology Risk: Participant–Informant Reported ECog-12 Scores and Discrepancy
Background
Early identification of Alzheimer's disease (AD) pathology remains challenging. Subjective cognitive assessments, including informant (study partner, SP)- and participant (PT)-reported scores on the 12-item Everyday Cognition scale (ECog-12) and their discrepancy, may capture pathological changes preceding clinical diagnosis. However, the combined utility of these measures for biomarker-based risk stratification has not been systematically evaluated.
Methods
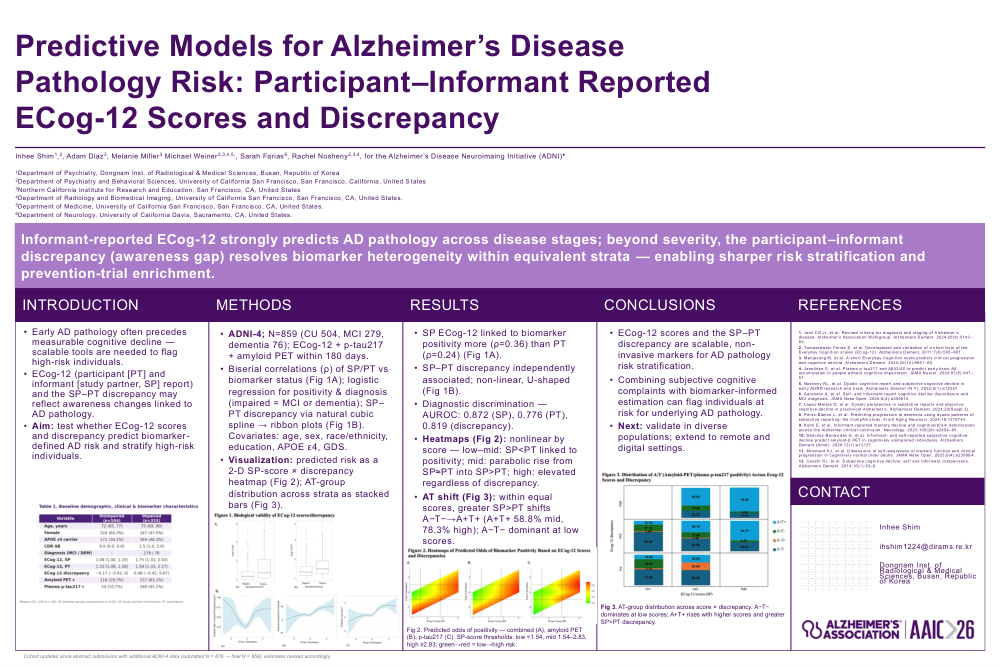
This cross-sectional analysis included 859 participants from the Alzheimer's Disease Neuroimaging Initiative-4 (ADNI-4) cohort (cognitively unimpaired, n = 504; cognitively impaired [mild cognitive impairment or dementia], n = 355) with available ECog-12 scores, plasma p-tau217, and amyloid PET data acquired within a 180-day window. SP–PT discrepancy was calculated as the arithmetic difference between SP and PT ECog-12 scores, with positive values indicating greater SP concern (SP > PT). Biserial correlations and logistic regression estimated associations of SP ECog-12 scores and the SP–PT discrepancy with biomarker positivity (amyloid PET or plasma p-tau217 above established thresholds) and clinical diagnosis; the discrepancy was modeled with a natural cubic spline (Figure 1B). Predicted odds of biomarker positivity were visualized across a 3×3 grid of ECog-12 score strata (low, mid, high) and discrepancy levels (SP < PT, SP ≈ PT, SP > PT) using two-dimensional heatmaps (Figure 2). AT biomarker distributions (A−T−, A−T+, A+T−, A+T+) were examined across the same strata as stacked bars (Figure 3).
Results
SP- and PT-reported ECog-12 scores both correlated with biomarker positivity, more strongly for SP (ρ = 0.36; 95% CI, 0.27–0.45) than PT (ρ = 0.24; 95% CI, 0.15–0.33) (Figure 1A). SP-reported scores also discriminated clinical diagnosis better than PT-reported scores (AUROC = 0.872 vs. 0.776). The SP–PT discrepancy showed a non-linear, U-shaped relationship with biomarker positivity (Figure 1B). Heatmap analyses revealed distinct nonlinear patterns across ECog-12 score strata (Figure 2). In the low-score range, PT-predominant reporting (SP < PT discrepancy) was associated with elevated biomarker positivity, consistent with a pre-symptomatic phase in which participant self-report precedes informant-detectable decline. In the mid-score range, biomarker positivity increased parabolically with greater SP > PT discrepancy, with A+T+ prevalence rising from 14.82% (low score, SP < PT discrepancy) to 38.10% and 58.82% at SP ≈ PT and SP > PT discrepancy, respectively. In the high-score range, biomarker positivity was consistently elevated regardless of discrepancy level, with A+T+ reaching 78.26% at SP > PT discrepancy. Within equivalent ECog-12 score ranges, SP–PT discrepancy direction and magnitude systematically explained biomarker heterogeneity: as SP > PT discrepancy increased, A−T− prevalence declined progressively while A+T+ became increasingly dominant (Figure 3).
Conclusions
SP-reported ECog-12 scores are strong predictors of AD pathology across disease stages. SP–PT discrepancies provide complementary information by resolving biomarker heterogeneity within equivalent cognitive severity strata, particularly in preclinical and early symptomatic phases. These findings support integration of awareness gap metrics into AD risk stratification protocols and participant enrichment strategies for secondary prevention trials.
Keywords
Alzheimer’s disease; subjective cognitive decline; study partner report; informant-participant discrepancy; amyloid PET; plasma p-tau217; biomarker risk stratification; biomarker heterogeneity
Comments
Email is required but is not shown publicly.
Loading comments...