4,068 posters, 219 videos, 101 topics, 69 sessions, 14,365 authors, 6,128 institutions
ePostersLive by SciGen Technologies S.A. All rights reserved.
Alzheimer's Association International Conference 2026
July 12-15, 2026 | London, United Kingdom, and Online

3565
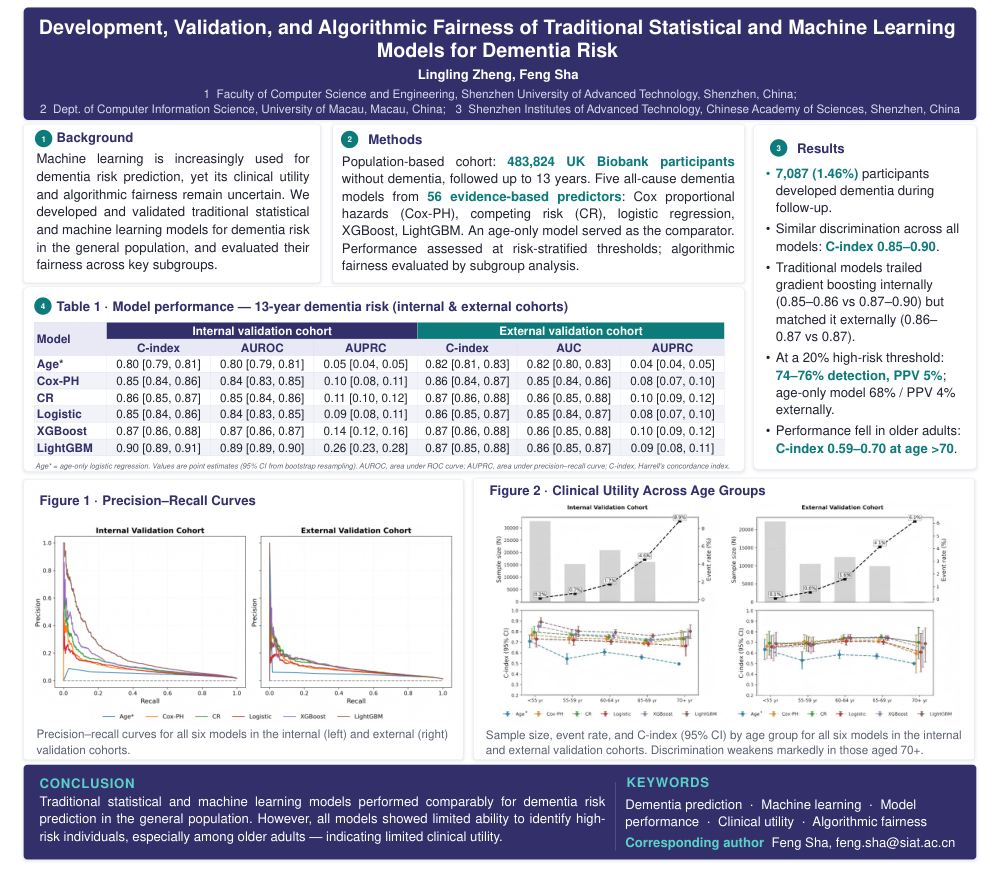
Development, Validation And Algorithmic Fairness Of Traditional Statistical And Machine Learning Models For Dementia Risk
Part of Topic
Development, Validation And Algorithmic Fairness Of Traditional Statistical And Machine Learning Models For Dementia Risk
Lingling Zheng, MS 1,2,3, Feng Sha, PhD 1,3,†
1 Faculty of Computer Science and Engineering, Shenzhen University of Advanced Technology, Shenzhen, Guangdong, China
2 Department of Computer Information Science, State Key Laboratory of Internet of Things for Smart City, University of Macau, Macau, China
3 Shenzhen Institutes of Advanced Technology, Chinese Academy of Sciences, Shenzhen, Guangdong, China
†Corresponding author.
†Correspondence to: Feng Sha, Ph.D., Faculty of Computer Science and Engineering, Shenzhen University of Advanced Technology, Shenzhen, Guangdong, 518055, China. Phone: +86-0755-86392055. Fax: +86-0755-8639229. E-mail: feng.sha@siat.ac.cn.
Abstract
Background
Machine learning is increasingly used in dementia risk prediction models, but their clinical utility and algorithmic fairness remain uncertain. This study aimed to develop and validate traditional statistical and machine learning models for dementia risk prediction in the general population and to evaluate their fairness across key subgroups.
Methods
This population-based cohort study followed 483,824 UK Biobank participants without dementia for up to 13 years. Five models for all-cause dementia were developed using 56 evidence-based predictors: Cox proportional hazards model (Cox-PH), competing event risk model (CR), logistic regression (LR), XGBoost, and LightGBM. An age-only model was also developed for comparison. Model performance was assessed at various risk-stratified thresholds, and algorithmic fairness was evaluated through subgroup analysis.
Results
During follow-up, 7,087 participants (1.46%) developed dementia. All models showed similar discrimination (C-index: 0.85-0.90). Although traditional statistical models (Cox-PH, CR, and LR) had lower C-indices than XGBoost and LightGBM in the internal validation cohort (0.85-0.86 vs. 0.87-0.90), their performance in the external validation cohort was similar (0.86-0.87 vs. 0.87). With 20% of the screening population identified as high-risk, detection rates ranged from 74% to 76%, with positive predictive values (PPV) of 5%, while the age-only model achieved 68% detection with PPV of 4% externally. The C-index decreased to 0.59-0.70 in those aged over 70 years.
Conclusion
Traditional statistical and machine learning models had comparable performance in predicting dementia risk within the general population. However, all models showed limited ability to predict high-risk individuals, especially in older populations, indicating limited clinical utility.
Keywords
Dementia prediction, machine learning, model performance, clinical utility, algorithmic fairness
Figure 1. Precision-Recall Curves for Developed Models in the Internal and External Validation Cohorts
Precision–recall curves are shown for the Age-only logistic regression model (Age*), Cox proportional hazards model (Cox-PH), competing risk model treating non-dementia death as a competing event (CR), multivariable logistic regression (Logistic), XGBoost, and LightGBM in the internal (left) and external (right) validation cohorts.
Figure 2. Clinical Utility of Dementia Risk Prediction Models Across Age Groups in Internal and External Validation Cohorts
This figure displays the sample sizes and event rates across different age groups, along with the C-index performance of the Age-only logistic regression model (Age*), Cox proportional hazards model (Cox-PH), competing risk model treating non-dementia death as a competing event (CR), multivariable logistic regression (Logistic), XGBoost, and LightGBM models in both internal and external validation cohorts.
Table 1. Model performance of developed six models to estimate 13-year dementia risk in internal and external cohorts
|
Models |
Internal validation cohort |
|
External validation cohort |
||||
|
Point estimate [95% CI *] |
|
Point estimate [95% CI *] |
|||||
|
C-index |
AUROC |
AUPRC |
|
C-index |
AUC |
AUPRC |
|
|
Age* |
0.80 [0.79, 0.81] |
0.80 [0.79, 0.81] |
0.05 [0.04, 0.05] |
|
0.82 [0.81, 0.83] |
0.82 [0.80, 0.83] |
0.04 [0.04, 0.05] |
|
Cox-PH |
0.85 [0.84, 0.86] |
0.84 [0.83, 0.85] |
0.10 [0.08, 0.11] |
|
0.86 [0.84, 0.87] |
0.85 [0.84, 0.86] |
0.08 [0.07, 0.10] |
|
CR |
0.86 [0.85, 0.87] |
0.85 [0.84, 0.86] |
0.11 [0.10, 0.12] |
|
0.87 [0.86, 0.88] |
0.86 [0.85, 0.88] |
0.10 [0.09, 0.12] |
|
Logistic |
0.85 [0.84, 0.86] |
0.84 [0.83, 0.85] |
0.09 [0.08, 0.11] |
|
0.86 [0.85, 0.87] |
0.85 [0.84, 0.87] |
0.08 [0.07, 0.10] |
|
XGBoost |
0.87 [0.86, 0.88] |
0.87 [0.86, 0.87] |
0.14 [0.12, 0.16] |
|
0.87 [0.86, 0.88] |
0.86 [0.85, 0.88] |
0.10 [0.09, 0.12] |
|
LightGBM |
0.90 [0.89, 0.91] |
0.89 [0.89, 0.90] |
0.26 [0.23, 0.28] |
|
0.87 [0.85, 0.88] |
0.86 [0.85, 0.87] |
0.09 [0.08, 0.11] |
Age* denotes the age-only logistic regression model. Values are point estimates (95% confidence intervals). 95% CIs were estimated using bootstrap resampling.
Abbreviations: Cox-PH, Cox proportional hazards model; CR, competing risk model treating non-dementia death as a competing event. AUROC, area under the receiver operating characteristic curve; AUPRC, area under the precision–recall curve; C-index, Harrell’s concordance index.
Comments
Email is required but is not shown publicly.
Loading comments...