4,068 posters, 219 videos, 101 topics, 69 sessions, 14,365 authors, 6,128 institutions
ePostersLive by SciGen Technologies S.A. All rights reserved.
Alzheimer's Association International Conference 2026
July 12-15, 2026 | London, United Kingdom, and Online

9700
Cumulative Dopamine-Agonist Exposure Predicts Impulse Control Disorder Severity In Parkinson’s Disease: A Longitudinal Modelling Study
Poster Presenter
Authors
Affiliations
Part of Topic
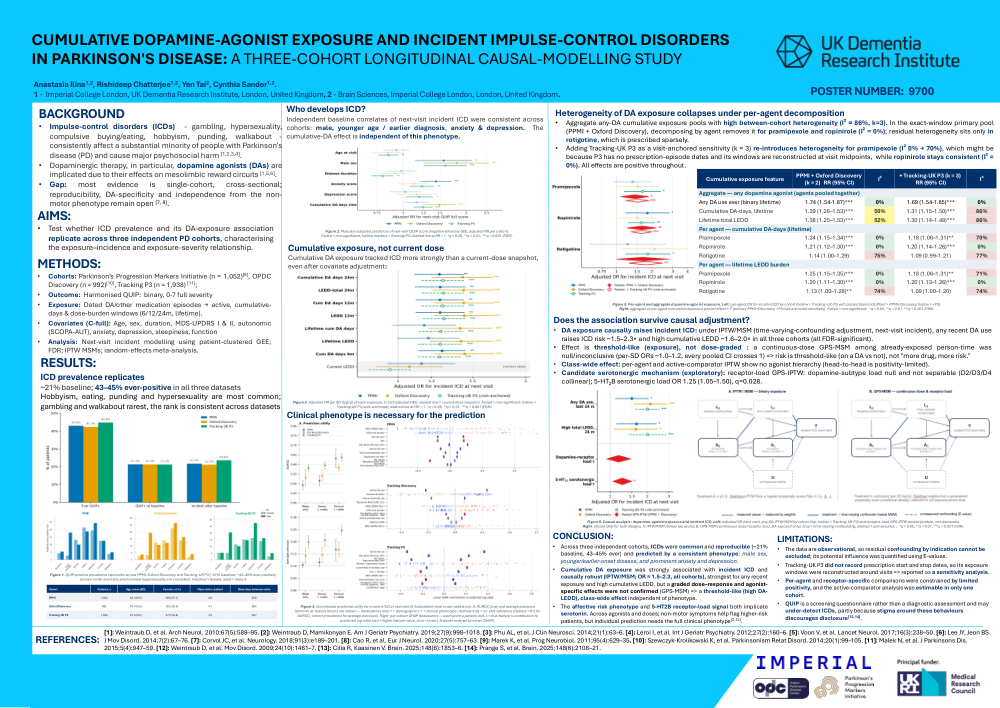
Cumulative Dopamine-Agonist Exposure and Incident Impulse-Control Disorders in Parkinson's Disease: A Three-Cohort Longitudinal Causal-Modelling Study
Anastasia Ilina¹,²; Rishideep Chatterjee¹,²; Yen Tai²; Cynthia Sandor¹,² — UK Dementia Research Institute & Department of Brain Sciences, Imperial College London. Poster 9700.
Background
Impulse-control disorders (ICDs), such as gambling, hypersexuality, compulsive buying/eating, hobbyism, punding, walkabout, affect a substantial minority of people with Parkinson's disease (PD) and cause major psychosocial harm [1–4]. Dopamine agonists (DAs) are implicated through mesolimbic reward circuits [1,5,6]. Most prior evidence is single-cohort and cross-sectional; reproducibility, DA-specificity and independence from the non-motor phenotype remain open [7,8].
Aims
Test whether ICD prevalence and its DA-exposure association replicate across three independent PD cohorts, and characterise the exposure–incidence/severity relationship.
Methods
Cohorts: PPMI (n=1,052) [9], OPDC Discovery (n=992) [10], Tracking-UK P3 (n=1,938) [11]. Outcome: harmonised QUIP (binary and 0–7 severity) [12]. Exposure: dated medication episodes → active, cumulative-days and dose-burden windows (6/12/24 m, lifetime). Covariates (C-full): age, sex, disease duration, MDS-UPDRS I & II, SCOPA-AUT, anxiety, depression, sleepiness, function. Analysis: next-visit incident modelling with patient-clustered GEE; FDR; IPTW marginal structural models; random-effects meta-analysis.
Results
ICD prevalence replicates (Figure 1, Table 1). Ever-positive 43.0% (PPMI) / 42.3% (Discovery) / 44.8% (P3); baseline 21.3 / 21.3 / 21.2%; incident-after-baseline 21.7 / 21.1 / 23.6%. Hobbyism, eating, hypersexuality and punding are commonest; gambling and walkabout rarest; rank consistent across cohorts. Hypersexuality is strongly male-predominant (~20% of males vs ~5% of females in P3); buying/eating slightly higher in women. Table 1: PPMI age 62.4 (9.5), 37.1% female, 4.8 visits/patient, 406 days between visits; Discovery 67.4 (9.5), 35.5% female, 4.1 visits, 665 days (age-approximated); P3 67.6 (9.2), 34.8% female, 3.5 visits, 587 days.
Independent predictors of incident ICD (Figure 2; mutually-adjusted, next-visit QUIP score; RR [95% CI], FDR q).
| Predictor (per SD unless noted) | PPMI | Oxford Discovery | Tracking-UK P3 |
|---|---|---|---|
| Age at visit | 0.93 (0.80–1.07) | 0.85 (0.71–1.00) | 0.85 (0.76–0.95)** |
| Male sex | 1.56 (1.14–2.13)* | 1.80 (1.26–2.58)** | 1.59 (1.25–2.01)*** |
| Disease duration | 0.98 (0.82–1.16) | 0.91 (0.77–1.08) | 0.80 (0.70–0.90)** |
| Anxiety | 1.43 (1.21–1.70)*** | 1.13 (0.95–1.33) | 1.23 (1.07–1.41)** |
| Depression | 1.02 (0.86–1.22) | 1.16 (0.93–1.46) | 1.19 (1.03–1.39)* |
| Cumulative DA-days 24 m | 1.16 (1.01–1.33) | 1.49 (1.25–1.77)*** | 1.24 (1.12–1.38)*** |
Male sex is consistently the strongest predictor; anxiety is significant in PPMI and P3 (not Discovery), depression only in P3; cumulative DA-days remains positive after adjustment (significant in Discovery and P3; FDR-NS in PPMI, q=0.089). Anxiety/depression instruments differ by cohort (STAI/GDS in PPMI; HADS/BDI in Discovery; HADS in P3).
Cumulative exposure, not current dose (Figure 3; adjusted OR per SD log1p, next-visit incident, C-full). Cumulative exposure was associated across all windows (6/12/24 m and lifetime); the current-dose snapshot was null. 24-month cumulative DA-days: PPMI 1.25 (1.09–1.43), Discovery 1.42 (1.20–1.68), P3 1.27 (1.13–1.43); total LEDD-24 m: PPMI 1.26 (1.09–1.44), Discovery 1.43 (1.21–1.68), P3 1.28 (1.14–1.44); all FDR-significant. Current LEDD (shaded comparator): PPMI 1.14 (0.94–1.36), Discovery 1.06 (0.89–1.27), P3 0.96 (0.85–1.08) — none significant.
Clinical phenotype is necessary for prediction (Figure 4; logistic regression, screened medication features, 5-fold patient-level CV; AUROC / average precision). Adding the clinical phenotype gave the highest discrimination in every cohort: clinical+meds AUROC 0.63 / 0.58 / 0.64 (PPMI / Discovery / P3) with AP 0.17 / 0.17 / 0.25 (vs no-skill prevalence 0.10 / 0.11 / 0.15). Medication-only was at chance in PPMI (AUROC 0.49, AP 0.10 ≈ no-skill) and only modestly above chance in Discovery (0.53) and P3 (0.58); adding demographics changed little (0.51 / 0.54 / 0.60). SHAP shows DA-exposure features among the top contributors within the full model but adding little stand-alone discrimination.
Heterogeneity collapses under per-agent decomposition (Figure 5, right; pooled RR [95% CI], I²). Any DA ever 1.74 (1.54–1.87), I²=0%. Cumulative DA-days lifetime 1.39 (1.26–1.53), I²=50% (PPMI+Discovery primary) → 1.31 (1.15–1.50), I²=86% (+P3); lifetime LEDD 1.38, I²=52% → 1.30, I²=86%. Per agent: pramipexole 1.24 (1.15–1.34) I²=0% (→1.18, I²=70% +P3); ropinirole 1.21 (1.12–1.30)*** I²=0% (→1.20, I²=0%); rotigotine 1.14 (1.00–1.29), I²=75% (NS).
Per-agent incident risk (Figure 5, left; any use last 12 m vs none). Pramipexole — PPMI 1.37 (0.95–1.97), Discovery 1.51 (1.00–2.29), P3 1.66 (1.15–2.38); ropinirole — 1.83 (1.18–2.82), 1.50 (1.02–2.21), 1.63 (1.25–2.12); rotigotine — 1.24 (0.59–2.64), 2.11 (1.10–4.05), 1.85 (1.18–2.89). Pooled estimates significant for all three.
Causal analysis (Figure 6; IPTW/MSM, incident). Any DA, last 24 m — PPMI 1.50 (1.09–2.06), Discovery 2.12 (1.54–2.92), P3 2.01 (1.61–2.51); High total LEDD-24 m — PPMI 1.64 (1.12–2.39), Discovery 1.61 (1.07–2.44), P3 2.02 (1.43–2.86); all FDR-significant. The continuous-dose GPS-MSM among already-exposed person-time was null (per-SD ORs ~1.0–1.2, every pooled CI crossing 1). Receptor-load GPS-IPTW (pooled): total dopamine-receptor load ≈ 1.04 (0.83–1.30), not significant and not separable by subtype; 5-HT₂B serotonergic load 1.25 (1.05–1.50), q=0.028.
Conclusion
- ICDs were common and reproducible across three cohorts (~21% baseline, 43–45% ever) and predicted by a consistent phenotype: male sex, younger/earlier-onset disease, and prominent anxiety and depression.
- Cumulative DA exposure was strongly associated with incident ICD and causally robust (IPTW/MSM; OR ≈ 1.5–2.3, all cohorts), strongest for any recent exposure and high cumulative LEDD; a graded dose–response and agonist-specific effects were not confirmed (GPS-MSM) — a threshold-like, class-wide effect independent of phenotype.
- The affective risk phenotype and a 5-HT₂B receptor-load signal both implicate serotonin [13,14].
- Clinically, ICD vigilance applies across agonists and doses; non-motor symptoms help flag higher-risk patients, but individual prediction needs the full clinical phenotype [2,12].
Limitations
Observational (residual confounding by indication; E-values reported); P3 lacks prescription start/stop dates (visit-anchored windows, sensitivity only); per-agent/receptor contrasts positivity-limited (active-comparator estimable in one cohort); QUIP is a screening, not diagnostic, instrument and may under-detect ICDs due to stigma [13,14].
References
- Weintraub D, et al. Arch Neurol. 2010;67(5):589–95. 2. Weintraub D, Mamikonyan E. Am J Geriatr Psychiatry. 2019;27(9):998–1018. 3. Phu AL, et al. J Clin Neurosci. 2014;21(1):63–6. 4. Leroi I, et al. Int J Geriatr Psychiatry. 2012;27(2):160–6. 5. Voon V, et al. Lancet Neurol. 2017;16(3):238–50. 6. Lee JY, Jeon BS. J Mov Disord. 2014;7(2):67–76. 7. Corvol JC, et al. Neurology. 2018;91(3):e189–201. 8. Cao R, et al. Eur J Neurol. 2020;27(5):757–63. 9. Marek K, et al. Ann Clin Transl Neurol. 2018;5(12):1460–77. 10. Szewczyk-Krolikowski K, et al. Parkinsonism Relat Disord. 2014;20(1):99–105. 11. Malek N, et al. J Parkinsons Dis. 2015;5(4):947–59. 12. Weintraub D, et al. Mov Disord. 2009;24(10):1461–7. 13. Cilia R, Kaasinen V. Brain. 2025;148(6):1853–6. 14. Prange S, et al. Brain. 2025;148(6):2108–21.
Comments
Email is required but is not shown publicly.
Loading comments...