4,068 posters, 219 videos, 101 topics, 69 sessions, 14,365 authors, 6,128 institutions
ePostersLive by SciGen Technologies S.A. All rights reserved.
Alzheimer's Association International Conference 2026
July 12-15, 2026 | London, United Kingdom, and Online

4341
Ai-based Grading Of Brain Atrophy In Alzheimer’S Disease: A Comparison Against The Scheltens’ Visual Rating Scale
Poster Presenter
Authors
Hyungyou Park, Ashwati Vipin, Smriti Ghildiyal, Gursimar Bhalla, Hyunjae Yu, Hyunji Lee, Regina EY Kim, Nagaendran Kandiah, Donghyeon Kim
Affiliations
Research Institute, Neurophet Inc., Seoul, Republic of Korea, Dementia Research Centre (Singapore), Lee Kong Chian School of Medicine, Nanyang Technological University, Singapore, Singapore
Part of Topic
AI-Based Grading of Brain Atrophy in Alzheimer's Disease: A Comparison against the Scheltens' Visual Rating Scale
AUTHORS
Hyungyou Park (1*), Ashwati Vipin (2), Smriti Ghildiyal (2), Gursimar Bhalla (2), Hyunjae Yu (1), Hyunji Lee (1), Regina EY Kim (1), Nagaendran Kandiah (2), Donghyeon Kim (1)
1. Research Institute, Neurophet Inc., Seoul, Republic of Korea
2. Dementia Research Centre (Singapore), Lee Kong Chian School of Medicine, Nanyang Technological University, Singapore
*Corresponding author: hyungyou.park@neurophet.com
Theme: Biomarkers. Topic: Neuroimaging. Subtopic: Novel imaging methods.
BACKGROUND & OBJECTIVE
Medial temporal lobe (MTL) atrophy is among the earliest and most robust MRI markers of Alzheimer's disease (AD) and a core neurodegeneration (N) biomarker in the NIA-AA AT(N) framework. The Scheltens visual medial temporal atrophy (MTA) scale (0-4) is the most widely used grading method, but it is subjective, ordinal/coarse, age-dependent, and prone to inter-rater variability, with limited sensitivity to early change. The occupancy index captures, in a single ratio, both hippocampal volume loss and compensatory inferior lateral ventricle (ILV) expansion, tracking the atrophic process more faithfully than volume alone. Objective: to develop an AI-based atrophy-grading approach using automated volumetric occupancy indices and benchmark it against conventional visual MTA scoring for discriminating cognitively normal (CN) from AD participants.
METHODS
Participants: 300 ADNI participants (150 CN, 150 AD), aged 55-89 years, balanced for age and sex (sex p = 0.817; age-group p = 0.719; mean age 73.1 vs 73.0 years). CN: MMSE >= 24, CDR 0. AD: NIA-AA criteria for probable AD dementia.
AI segmentation: 3D T1-weighted MRI was processed with Neurophet AQUA (a deep-learning Split-Attention U-Net) for automated whole-brain segmentation and regional volumes. AQUA has been validated across MRI field strengths, multi-center settings, and ethnically diverse cohorts.
Occupancy indices: HOC (hippocampal occupancy) = hippocampal volume / (hippocampal volume + ILV volume); mTOC (medial temporal occupancy) = medial temporal cortex volume / (medial temporal cortex volume + ILV volume); min-HOC and min-mTOC = the value of the more-atrophied hemisphere (per-hemisphere minimum). Index range 0-1; lower values indicate greater atrophy.
Visual reference standard: Scheltens MTA was rated on coronal T1 images by two board-certified neuroradiologists, blinded to diagnosis, with disagreements resolved by consensus; Max MTA = the higher of the left/right hemispheric scores.
Statistical analysis: group differences (HOC, mTOC, min-HOC, min-mTOC, Max MTA) were assessed by independent two-sample t-tests; AD classification used support vector machine (SVM) classifiers trained on occupancy-index features, compared with a Max MTA model; performance was reported as AUC and accuracy.
RESULTS
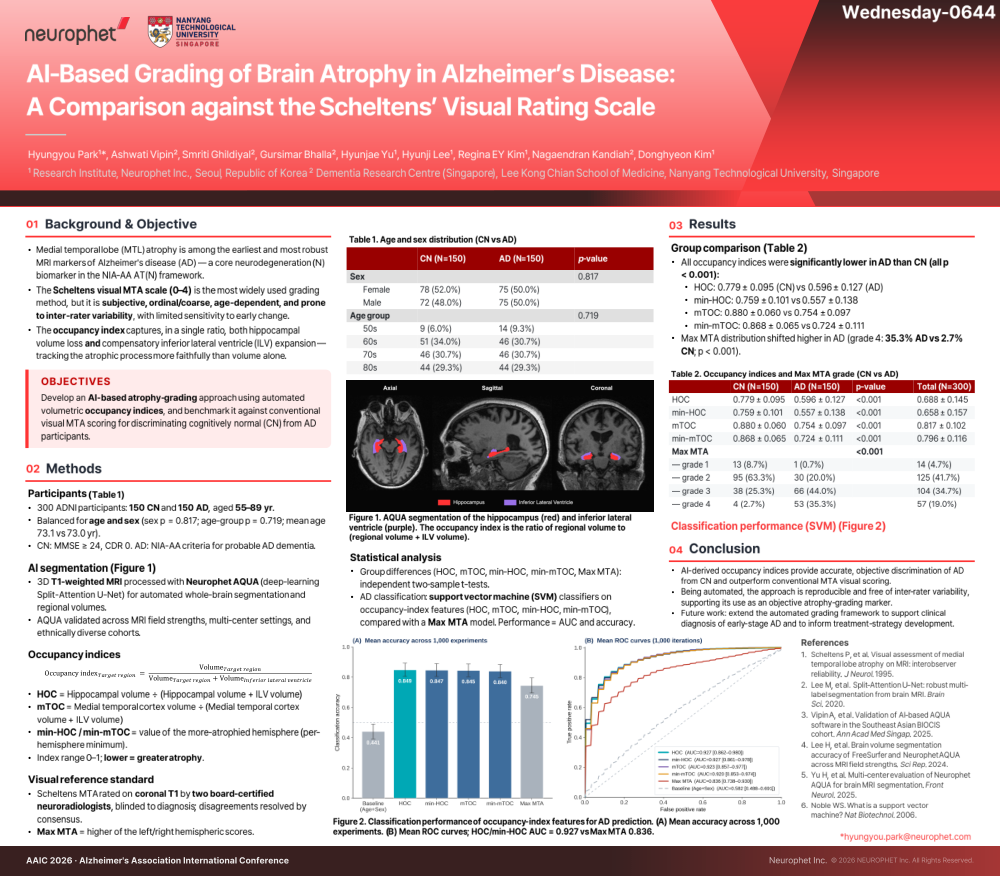
Group comparison: all occupancy indices were significantly lower in AD than CN (all p < 0.001): HOC 0.779 +/- 0.095 (CN) vs 0.596 +/- 0.127 (AD); min-HOC 0.759 +/- 0.101 vs 0.557 +/- 0.138; mTOC 0.880 +/- 0.060 vs 0.754 +/- 0.097; min-mTOC 0.868 +/- 0.065 vs 0.724 +/- 0.111. The Max MTA distribution shifted higher in AD (grade 4: 35.3% AD vs 2.7% CN; p < 0.001).
Classification performance (SVM): occupancy-index models performed strongly. HOC and min-HOC were highest (AUC = 0.927; accuracy approximately 0.85), followed by mTOC (AUC = 0.923; accuracy approximately 0.845) and min-mTOC (AUC = 0.920; accuracy approximately 0.840). All occupancy-index models clearly outperformed the visual reference, Max MTA (AUC = 0.836; accuracy approximately 0.75).
CONCLUSION
AI-derived occupancy indices provide accurate, objective discrimination of AD from CN and outperform conventional MTA visual scoring. Being automated, the approach is reproducible and free of inter-rater variability, supporting its use as an objective atrophy-grading marker. Future work will extend the automated grading framework to support clinical diagnosis of early-stage AD and to inform treatment-strategy development.
TABLE 1 (Age and sex distribution, CN vs AD). Sex (p = 0.817): female 78 (52.0%) CN vs 75 (50.0%) AD; male 72 (48.0%) CN vs 75 (50.0%) AD. Age group (p = 0.719): 50s 9 (6.0%) vs 14 (9.3%); 60s 51 (34.0%) vs 46 (30.7%); 70s 46 (30.7%) vs 46 (30.7%); 80s 44 (29.3%) vs 44 (29.3%). Mean age 73.1 vs 73.0 years.
TABLE 2 (Occupancy indices and Max MTA grade, CN vs AD). HOC 0.779 +/- 0.095 vs 0.596 +/- 0.127 (p < 0.001); min-HOC 0.759 +/- 0.101 vs 0.557 +/- 0.138 (p < 0.001); mTOC 0.880 +/- 0.060 vs 0.754 +/- 0.097 (p < 0.001); min-mTOC 0.868 +/- 0.065 vs 0.724 +/- 0.111 (p < 0.001). Max MTA (p < 0.001): grade 1 13 (8.7%) vs 1 (0.7%); grade 2 95 (63.3%) vs 30 (20.0%); grade 3 38 (25.3%) vs 66 (44.0%); grade 4 4 (2.7%) vs 53 (35.3%).
FIGURE 1. AQUA segmentation of the hippocampus (red) and inferior lateral ventricle (purple). The occupancy index is the ratio of regional volume to (regional volume + ILV volume).
FIGURE 2. Classification performance of occupancy-index features for AD prediction. (A) Mean accuracy across 1,000 experiments. (B) Mean ROC curves; HOC/min-HOC AUC = 0.927 vs Max MTA AUC = 0.836.
REFERENCES
1. Scheltens P, et al. Visual assessment of medial temporal lobe atrophy on MRI: interobserver reliability. J Neurol. 1995.
2. Lee M, et al. Split-Attention U-Net: robust multi-label segmentation from brain MRI. Brain Sci. 2020.
3. Vipin A, et al. Validation of AI-based AQUA software in the Southeast Asian BIOCIS cohort. Ann Acad Med Singap. 2025.
4. Lee H, et al. Brain volume segmentation accuracy of FreeSurfer and Neurophet AQUA across MRI field strengths. Sci Rep. 2024.
5. Yu H, et al. Multi-center evaluation of Neurophet AQUA for brain MRI segmentation. Front Neurol. 2025.
6. Noble WS. What is a support vector machine? Nat Biotechnol. 2006.
KEYWORDS
Alzheimer's disease; AD; brain atrophy; medial temporal lobe atrophy; hippocampus; hippocampal atrophy; inferior lateral ventricle; occupancy index; hippocampal occupancy; HOC; medial temporal occupancy; mTOC; Scheltens; medial temporal atrophy; MTA visual rating scale; MRI; T1-weighted MRI; automated brain segmentation; deep learning; Neurophet AQUA; Split-Attention U-Net; support vector machine; SVM; AUC; ROC; neuroimaging biomarker; ADNI; NIA-AA AT(N); cognitively normal; quantitative atrophy grading; volumetric analysis.
Comments
Email is required but is not shown publicly.
Loading comments...