4,068 posters, 219 videos, 101 topics, 69 sessions, 14,365 authors, 6,128 institutions
ePostersLive by SciGen Technologies S.A. All rights reserved.
Alzheimer's Association International Conference 2026
July 12-15, 2026 | London, United Kingdom, and Online

1183
Alzheimer’s Disease Across Diverse Populations: A Comparative Review Of White, African American, Hispanic, And Middle Eastern Cohorts
Poster Presenter
Authors
Affiliations
Part of Topic
KEY TAKEAWAY
Alzheimer's disease differs across White, African American, Hispanic, and Middle Eastern populations in risk, biomarkers, and disease progression. Vascular and metabolic health, genetic ancestry, and social factors all influence outcomes, highlighting the need for population-specific diagnostic and risk prediction models.
METHODS
We synthesized peer-reviewed evidence on Alzheimer's risk, clinical features, biomarkers, and progression across White, African American, Hispanic, and Middle Eastern populations, focusing on vascular-metabolic factors, social determinants, cognitive outcomes, and biomarker-clinical links.
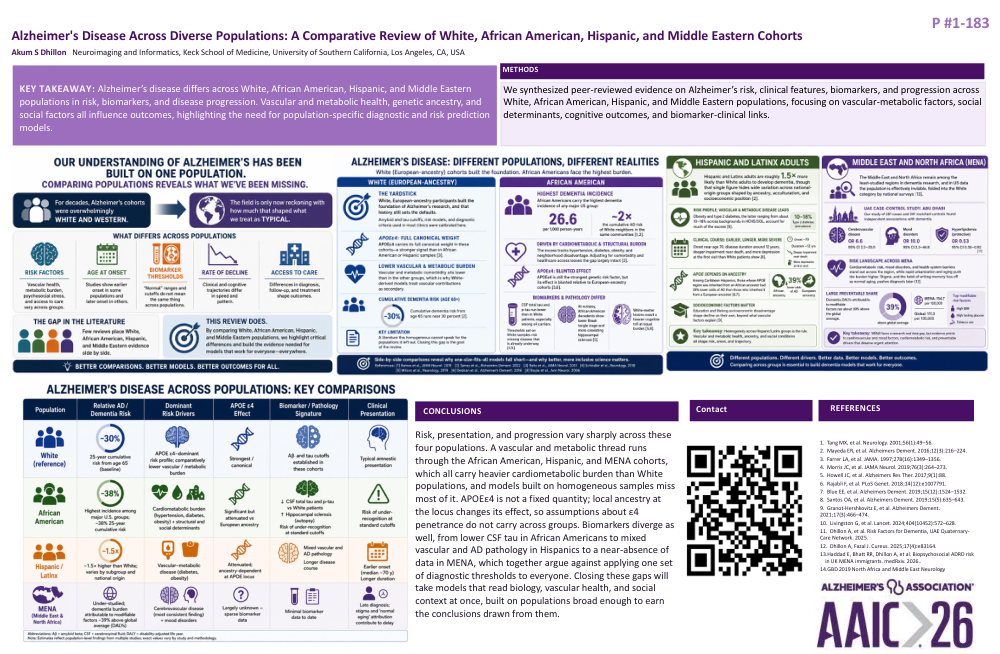
FIGURE 1 (infographic, left): OUR UNDERSTANDING OF ALZHEIMER'S HAS BEEN BUILT ON ONE POPULATION. Comparing populations reveals what we've been missing.
- For decades, Alzheimer's cohorts were overwhelmingly WHITE AND WESTERN.
- The field is only now reckoning with how much that shaped what we treat as TYPICAL.
WHAT DIFFERS ACROSS POPULATIONS
- RISK FACTORS: Vascular health, metabolic burden, psychosocial stress, and access to care vary across groups.
- AGE AT ONSET: Studies show earlier onset in some populations and later onset in others.
- BIOMARKER THRESHOLDS: "Normal" ranges and cutoffs do not mean the same thing across populations.
- RATE OF DECLINE: Clinical and cognitive trajectories differ in speed and pattern.
- ACCESS TO CARE: Differences in diagnosis, follow-up, and treatment shape outcomes.
THE GAP IN THE LITERATURE: Few reviews place White, African American, Hispanic, and Middle Eastern evidence side by side.
THIS REVIEW DOES: By comparing White, African American, Hispanic, and Middle Eastern populations, we highlight critical differences and build the evidence needed for models that work for everyone—everywhere.
Banner: BETTER COMPARISONS. BETTER MODELS. BETTER OUTCOMES FOR ALL.
FIGURE 2 (center): ALZHEIMER'S DISEASE: DIFFERENT POPULATIONS, DIFFERENT REALITIES
Subhead: White (European-ancestry) cohorts built the foundation. African Americans face the highest burden.
WHITE (EUROPEAN-ANCESTRY)
- THE YARDSTICK: White, European-ancestry participants built the foundation of Alzheimer's research, and that history still sets the defaults. Amyloid and tau cutoffs, risk models, and diagnostic criteria used in most clinics were calibrated here.
- APOEε4: FULL CANONICAL WEIGHT: APOEε4 carries its full canonical weight in these cohorts—a stronger signal than in African American or Hispanic samples [3].
- LOWER VASCULAR & METABOLIC BURDEN: Vascular and metabolic comorbidity sits lower than in the other groups, which is why White-derived models treat vascular contributions as secondary.
- CUMULATIVE DEMENTIA RISK (AGE 65+): ~30%. Cumulative dementia risk from age 65 runs near 30 percent [2].
- KEY LIMITATION: A literature this homogeneous cannot speak for the populations it left out. Closing this gap is the goal of the review.
AFRICAN AMERICAN
- HIGHEST DEMENTIA INCIDENCE: African Americans carry the highest dementia incidence of any major US group: 26.6 per 1,000 person-years, ~2× the cumulative AD risk of White neighbors in the same communities [1,2].
- DRIVEN BY CARDIOMETABOLIC & STRUCTURAL BURDEN: The excess tracks hypertension, diabetes, obesity, and neighborhood disadvantage. Adjusting for comorbidity and healthcare access leaves the gap largely intact [2].
- APOEε4: BLUNTED EFFECT: APOEε4 is still the strongest genetic risk factor, but its effect is blunted relative to European-ancestry cohorts [3,6].
- BIOMARKERS & PATHOLOGY DIFFER:
- CSF total tau and p-tau run lower than in White patients, especially among ε4 carriers. Thresholds set on White samples risk missing disease that is already underway [4,5].
- At autopsy, African American decedents show lower Braak tangle stage and more coexisting hippocampal sclerosis [5].
- White-matter lesions exact a heavier cognitive toll at equal burden [5,8].
Banner: Side-by-side comparisons reveal why one-size-fits-all models fall short—and why better, more inclusive science matters.
References (this section): [1] Barnes et al., JAMA Neurol. 2018 [2] Tamez et al., Alzheimers Dement. 2022 [3] Reitz et al., JAMA Neurol. 2013 [4] Schindler et al., Neurology. 2018 [5] Wilson et al., Neurology. 2019 [6] Desikan et al., Alzheimer's Dement. 2016 [8] Boyle et al., Ann Neurol. 2006
FIGURE 3: HISPANIC AND LATINX ADULTS
- Hispanic and Latinx adults are roughly 1.5× more likely than White adults to develop dementia, though that single figure hides wide variation across national-origin groups shaped by ancestry, acculturation, and socioeconomic position [2].
- RISK PROFILE: VASCULAR & METABOLIC DISEASE LEADS: Obesity and type 2 diabetes, the latter ranging from about 10–18% across backgrounds in HCHS/SOL, account for much of the excess [9]. (Callout: 10–18% Type 2 diabetes prevalence)
- CLINICAL COURSE: EARLIER, LONGER, MORE SEVERE: Onset near age 70, disease duration around 12 years, deeper impairment near death, and more depression at the first visit than White patients show [8]. (Callouts: Onset ~70; Duration ~12 yrs; Deeper impairment near death; More depression at first visit)
- APOE DEPENDS ON ANCESTRY: Among Caribbean Hispanics, those whose APOE region was inherited from an African ancestor had 39% lower odds of AD than those who inherited it from a European ancestor [6,7]. (Callout: 39% lower odds of AD, African ancestry vs European ancestry)
- SOCIOECONOMIC FACTORS MATTER: Education and lifelong socioeconomic disadvantage shape decline on their own, beyond what vascular factors explain [9].
- Key takeaway: Heterogeneity across Hispanic/Latinx groups is the rule. Vascular and metabolic health, ancestry, and social conditions all shape risk, onset, and trajectory.
FIGURE 4: MIDDLE EAST AND NORTH AFRICA (MENA)
- The Middle East and North Africa remain among the least-studied regions in dementia research, and in US data the population is effectively invisible, folded into the White category by national surveys [13].
- UAE CASE-CONTROL STUDY: ABU DHABI: Our study of 281 cases and 281 matched controls found independent associations with dementia.
- Cerebrovascular disease: OR 6.6 (95% CI 2.2–20.0)
- Mood disorders: OR 10.0 (95% CI 2.3–44.8)
- Hyperlipidemia (protective): OR 0.53 (95% CI 0.30–0.92) [11]
- RISK LANDSCAPE ACROSS MENA: Cardiometabolic risk, mood disorders, and health-system barriers stand out across the region, while rapid urbanization and aging push the burden higher. Stigma, and the habit of writing memory loss off as normal aging, pushes diagnosis later [12].
- LARGE PREVENTABLE SHARE: Dementia DALYs attributable to modifiable factors run about 39% above global average. (Callouts: 39% above global average; MENA 154.7 per 100,000; Global 111.3 per 100,000; Top modifiable risk factors: High BMI, High fasting glucose, Tobacco use)
- Key takeaway: MENA faces a research and data gap, but evidence points to cerebrovascular and mood factors, cardiometabolic risk, and preventable drivers that deserve urgent attention.
Banner (under Figures 3–4): Different populations. Different drivers. Better data. Better models. Better outcomes. Comparing across groups is essential to build dementia models that work for everyone.
TABLE: ALZHEIMER'S DISEASE ACROSS POPULATIONS: KEY COMPARISONS
Columns: Population | Relative AD / Dementia Risk | Dominant Risk Drivers | APOE ε4 Effect | Biomarker / Pathology Signature | Clinical Presentation
White (reference)
- ~30%, 25-year cumulative risk from age 65 (baseline)
- APOE ε4-dominant risk profile; comparatively lower vascular / metabolic burden
- Strongest / canonical
- Aβ and tau cutoffs established in these cohorts
- Typical amnestic presentation
African American
- ~38%, highest incidence among major U.S. groups; ~38% 25-year cumulative risk
- Cardiometabolic burden (hypertension, diabetes, obesity) + structural and social determinants
- Significant but attenuated vs European ancestry
- ↓ CSF total tau and p-tau vs White patients; ↑ hippocampal sclerosis (autopsy); risk of under-recognition at standard cutoffs
- Risk of under-recognition at standard cutoffs
Hispanic / Latinx
- ~1.5× higher than White; varies by subgroup and national origin
- Vascular-metabolic disease (diabetes, obesity)
- Attenuated; ancestry-dependent at APOE locus
- Mixed vascular and AD pathology; longer disease course
- Earlier onset (median ~70 y); longer duration
MENA (Middle East & North Africa)
- Under-studied; dementia burden attributable to modifiable factors ~39% above global average (DALYs)
- Cerebrovascular disease (most consistent finding) + mood disorders
- Largely unknown — sparse biomarker data
- Minimal biomarker data to date
- Late diagnosis; stigma and "normal aging" attribution contribute to delay
Abbreviations: Aβ = amyloid beta; CSF = cerebrospinal fluid; DALY = disability-adjusted life year.
Note: Estimates reflect population-level findings from multiple studies; exact values vary by study and methodology.
CONCLUSIONS
Risk, presentation, and progression vary sharply across these four populations. A vascular and metabolic thread runs through the African American, Hispanic, and MENA cohorts, which all carry heavier cardiometabolic burden than White populations, and models built on homogeneous samples miss most of it. APOEε4 is not a fixed quantity; local ancestry at the locus changes its effect, so assumptions about ε4 penetrance do not carry across groups. Biomarkers diverge as well, from lower CSF tau in African Americans to mixed vascular and AD pathology in Hispanics to a near-absence of data in MENA, which together argue against applying one set of diagnostic thresholds to everyone. Closing these gaps will take models that read biology, vascular health, and social context at once, built on populations broad enough to earn the conclusions drawn from them.
REFERENCES
- Tang MX, et al. Neurology. 2001;56(1):49–56.
- Mayeda ER, et al. Alzheimers Dement. 2016;12(3):216–224.
- Farrer LA, et al. JAMA. 1997;278(16):1349–1356.
- Morris JC, et al. JAMA Neurol. 2019;76(3):264–273.
- Howell JC, et al. Alzheimers Res Ther. 2017;9(1):88.
- Rajabli F, et al. PLoS Genet. 2018;14(12):e1007791.
- Blue EE, et al. Alzheimers Dement. 2019;15(12):1524–1532.
- Santos OA, et al. Alzheimers Dement. 2019;15(5):635–643.
- Granot-Hershkovitz E, et al. Alzheimers Dement. 2021;17(3):466–474.
- Livingston G, et al. Lancet. 2024;404(10452):572–628.
- Dhillon A, et al. Risk Factors for Dementia, UAE Quaternary-Care Network. 2025.
- Dhillon A, Fazal J. Cureus. 2025;17(4):e83164.
- Haddad E, Bhatt RR, Dhillon A, et al. Biopsychosocial ADRD risk in UK MENA immigrants. medRxiv. 2026.
- GBD 2019 North Africa and Middle East Neurology Collaborators. 2024.
Comments
Email is required but is not shown publicly.
Loading comments...