4,068 posters, 219 videos, 101 topics, 69 sessions, 14,365 authors, 6,128 institutions
ePostersLive by SciGen Technologies S.A. All rights reserved.
Alzheimer's Association International Conference 2026
July 12-15, 2026 | London, United Kingdom, and Online

5753
Longitudinal Vs. Cross-sectional Computational Speech Analysis In Alzheimer's Disease
Poster Presenter
Authors
Peter Pressman, Francesca Dino, Chelsea Chandler, Peter Foltz, Kevin Bretonnel Cohen, Steven Bedrick, Elliott Ross, Lawrence E. Hunter
Affiliations
Institute of Cognitive Science, University of Colorado, Boulder, Colorado, Third Battalion, Ukrainian Volunteer Army, Ukraine, Oregon Health & Science University, Layton Aging & Alzheimer's Disease Research Center, Portland, Oregon, University of Colorado Medical Campus, Department of Neurology, Aurora, Colorado, Medical Informatics and Clinical Epidemiology, Oregon Health & Science University, Portland, Oregon, University of Colorado Medical Campus, Department of Neurology, Aurora, Colorad, Department of Pediatrics, University of Chicago, Chicago, Illinois
Part of Topic
Longitudinal vs Cross-Sectional Speech Biomarkers in Dementia
Peter S. Pressman¹, Francesca Dino², Chelsea Chandler³, Kevin Bretonnel Cohen⁴, Steven Bedrick⁵, Elliott Ross², Peter Foltz³, Lawrence E. Hunter⁶
¹Layton Aging and Alzheimer's Disease Research Center, Department of Neurology, Oregon Health & Science University, Portland, OR; ²Department of Neurology, University of Colorado Anschutz Medical Campus, Aurora, CO; ³Institute of Cognitive Science, University of Colorado Boulder, Boulder, CO; ⁴Third Battalion, Ukrainian Volunteer Army, Ukraine; ⁵Medical Informatics and Clinical Epidemiology, Oregon Health & Science University, Portland, OR; ⁶Department of Pediatrics, University of Chicago, Chicago, IL
Introduction
- Speech reflects cognition; dementia changes speech.
- Most speech-biomarker studies have been single-visit, patient versus control.
- But Alzheimer's disease and related disorders are diseases of trajectory.
- Q1: Does rate of change add diagnostic signal beyond one visit?
- Q2: Do linguistic and acoustic features differ in approximation of diagnosis versus progression?
Methods
- Corpus: DementiaBank Pitt Corpus, Cookie Theft; Control vs probable AD, two or more visits.
- Features: 95 linguistic (lexical diversity, psycholinguistic norms, syntax); 528 acoustic (eGeMAPS via OpenSMILE).
- Design: per-individual slopes; three analyses under nested 5-fold CV, first visit, last visit, trajectory.
- Selection: top features by importance within each training fold; five classifiers tested, highest-AUC reported.
- Cohort: 149 with two or more visits, 119 Control or AD; matched to 82 to 86 per analysis, 32 acoustic last visit.
- AUC with 1000-iteration bootstrap 95% CIs.
Results
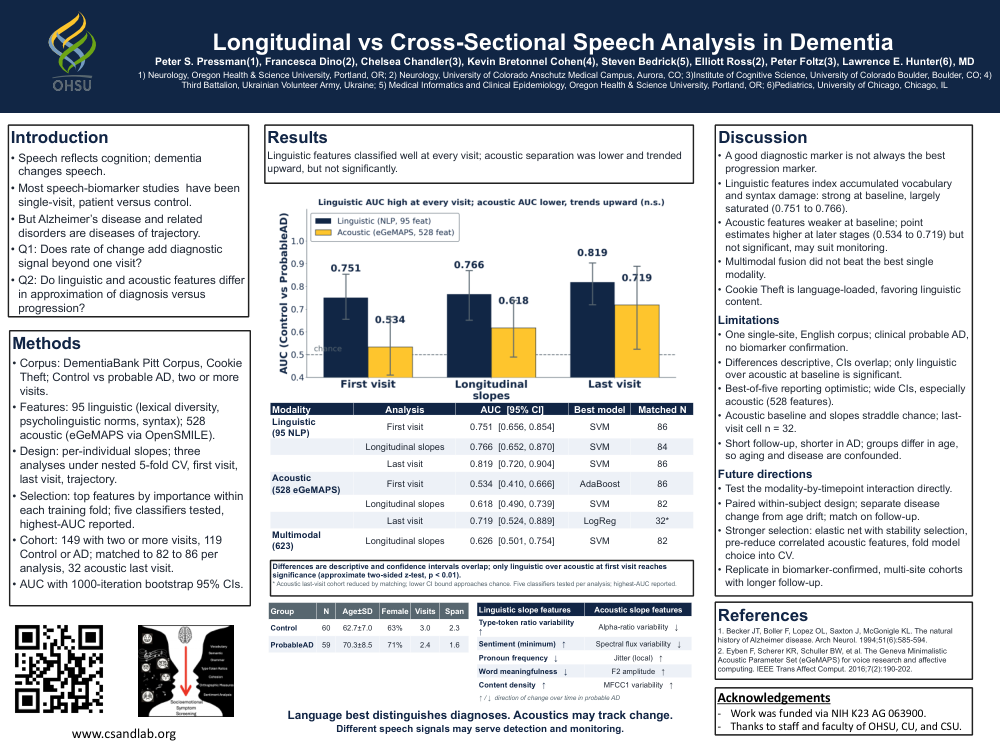
Linguistic features classified well at every visit; acoustic separation was lower and trended upward, but not significantly.
Modality | Analysis | AUC [95% CI] | Best model | Matched N
- Linguistic (95 NLP) — First visit: 0.751 [0.656, 0.854], SVM, 86 · Longitudinal slopes: 0.766 [0.652, 0.870], SVM, 84 · Last visit: 0.819 [0.720, 0.904], SVM, 86
- Acoustic (528 eGeMAPS) — First visit: 0.534 [0.410, 0.666], AdaBoost, 86 · Longitudinal slopes: 0.618 [0.490, 0.739], SVM, 82 · Last visit: 0.719 [0.524, 0.889], LogReg, 32*
- Multimodal (623) — Longitudinal slopes: 0.626 [0.501, 0.754], SVM, 82
Group | N | Age±SD | Female | Visits | Span
- Control: 60 | 62.7±7.0 | 63% | 3.0 | 2.3
- ProbableAD: 59 | 70.3±8.5 | 71% | 2.4 | 1.6
Linguistic slope features | Acoustic slope features (↑/↓ = direction of change over time in probable AD)
- Type-token ratio variability ↑ | Alpha-ratio variability ↓
- Sentiment (minimum) ↑ | Spectral flux variability ↓
- Pronoun frequency ↓ | Jitter (local) ↑
- Word meaningfulness ↓ | F2 amplitude ↑
- Content density ↑ | MFCC1 variability ↑
Discussion
- A good diagnostic marker is not always the best progression marker.
- Linguistic features index accumulated vocabulary and syntax damage: strong at baseline, largely saturated (0.751 to 0.766).
- Acoustic features weaker at baseline; point estimates higher at later stages (0.534 to 0.719) but not significant, may suit monitoring.
- Multimodal fusion did not beat the best single modality.
- Cookie Theft is language-loaded, favoring linguistic content.
Limitations
- One single-site, English corpus; clinical probable AD, no biomarker confirmation.
- Differences descriptive, CIs overlap; only linguistic over acoustic at baseline is significant.
- Best-of-five reporting optimistic; wide CIs, especially acoustic (528 features).
- Acoustic baseline and slopes straddle chance; last-visit cell n = 32.
- Short follow-up, shorter in AD; groups differ in age, so aging and disease are confounded.
Future directions
- Test the modality-by-timepoint interaction directly.
- Paired within-subject design; separate disease change from age drift; match on follow-up.
- Stronger selection: elastic net with stability selection, pre-reduce correlated acoustic features, fold model choice into CV.
- Replicate in biomarker-confirmed, multi-site cohorts with longer follow-up.
Differences are descriptive and confidence intervals overlap; only linguistic over acoustic at first visit reaches significance (approximate two-sided z-test, p < 0.01). Acoustic last-visit cohort reduced by matching; lower CI bound approaches chance. Five classifiers tested per analysis; highest-AUC reported.
References
- Becker JT, Boller F, Lopez OL, Saxton J, McGonigle KL. The natural history of Alzheimer disease. Arch Neurol. 1994;51(6):585-594.
- Eyben F, Scherer KR, Schuller BW, et al. The Geneva Minimalistic Acoustic Parameter Set (eGeMAPS) for voice research and affective computing. IEEE Trans Affect Comput. 2016;7(2):190-202.
Acknowledgements
- Work was funded via NIH K23 AG 063900.
- Thanks to staff and faculty of OHSU, CU, and CSU.
Language best distinguishes diagnoses. Acoustics may track change. Different speech signals may serve detection and monitoring.
Comments
Email is required but is not shown publicly.
Loading comments...