4,068 posters, 219 videos, 101 topics, 69 sessions, 14,365 authors, 6,128 institutions
ePostersLive by SciGen Technologies S.A. All rights reserved.
Alzheimer's Association International Conference 2026
July 12-15, 2026 | London, United Kingdom, and Online

4736
Deep Learning Based Annual Brain Parenchyma Loss Explains One Third Of The Variability In Cognitive Decline In Alzheimer’s Disease
Poster Presenter
Part of Topic
Background
Brain atrophy is a core pathological feature of Alzheimer’s disease (AD) and closely linked to cognitive decline. Quantifying longitudinal loss of brain parenchyma volume (BVL) across the AD continuum using scalable and robust methods remains a key challenge.
Methods
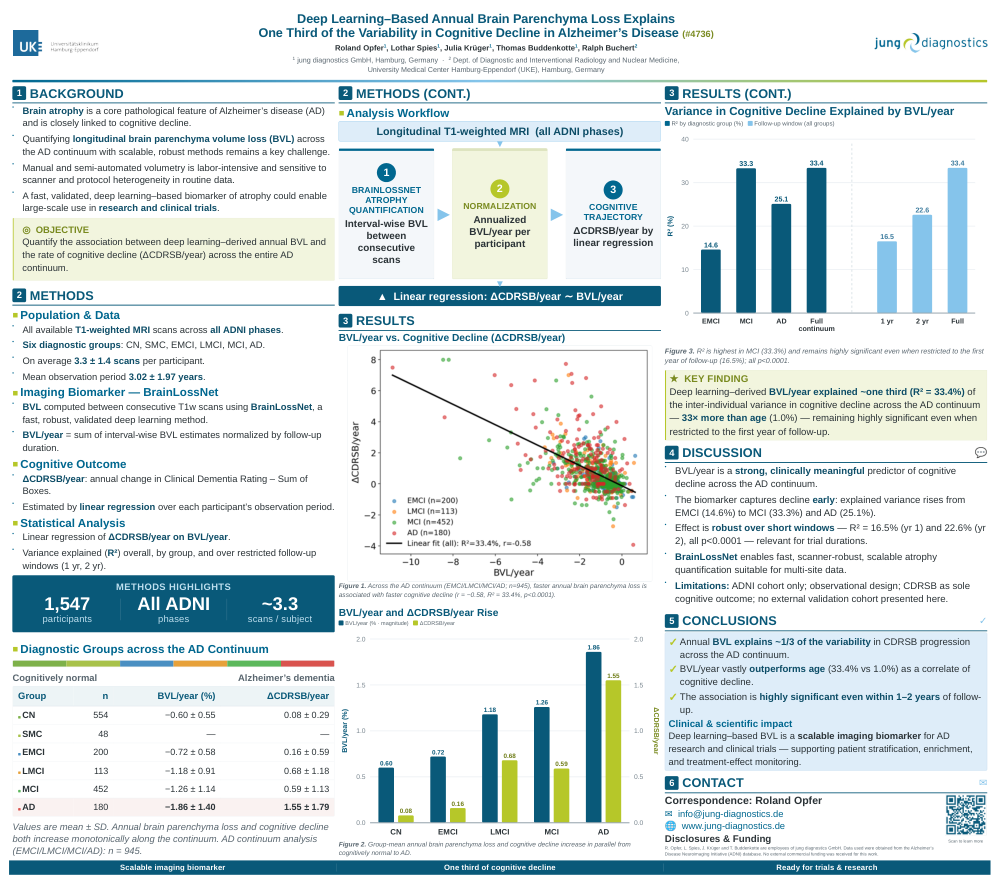
All available T1-weighted (T1w) MRI scans across all ADNI phases were included. Cognitive decline was characterized by the annual change in the Clinical Dementia Rating Sum of Boxes (ΔCDRSB/year), estimated by linear regression over each participant’s observation period. BVL was computed between consecutive T1w scans using BrainLossNet, a fast, robust, and validated deep learning–based method. Average BVL/year was calculated for each participant by summing interval-wise BVL estimates and normalizing by follow-up duration. Linear regression assessed the association between BVL/year and ΔCDRSB/year.
Results
The analysis included cognitively normal (CN, n=554), subjective memory complaint (SMC, n=48), early MCI (EMCI, n=200), late MCI (LMCI, n=113), MCI (n=452), and AD (n=180) participants with on average 3.3±1.4 T1w MRI scans and a mean observation period of 3.02±1.97 years. Mean BVL/year (in%) increased from CN (−0.60±0.55) and EMCI (−0.72±0.58) to LMCI (−1.18±0.91), MCI (−1.26±1.14), and AD (−1.86±1.40). Mean ΔCDRSB/year showed a corresponding increase from CN (0.08±0.29) and EMCI (0.16±0.59) to LMCI (0.68±1.18), MCI (0.59±1.13), and AD (1.55±1.79). Across the AD continuum (EMCI/LMCI/MCI/AD; n=945), BVL/year explained R²=33.4% of the inter-individual variance in ΔCDRSB/year (p<0.0001), whereas age explained only 1.0%. Explained variance ranged from 14.6% in EMCI to 33.3% in MCI and 25.1% in AD. Restricting analyses to data from the first two years or first year reduced explained variance (R²=22.6% and 16.5%) but remained highly significant (p<0.0001).
Conclusions
BrainLossNet-derived BVL/year is a strong and clinically meaningful predictor of cognitive decline across the AD continuum, explaining approximately one third of the variability in CDRSB progression. These findings support deep learning–based BVL estimation as a scalable imaging biomarker for Alzheimer’s disease research and clinical trials.
Comments
Email is required but is not shown publicly.
Loading comments...