4,068 posters, 219 videos, 101 topics, 69 sessions, 14,365 authors, 6,128 institutions
ePostersLive by SciGen Technologies S.A. All rights reserved.
Alzheimer's Association International Conference 2026
July 12-15, 2026 | London, United Kingdom, and Online

1886
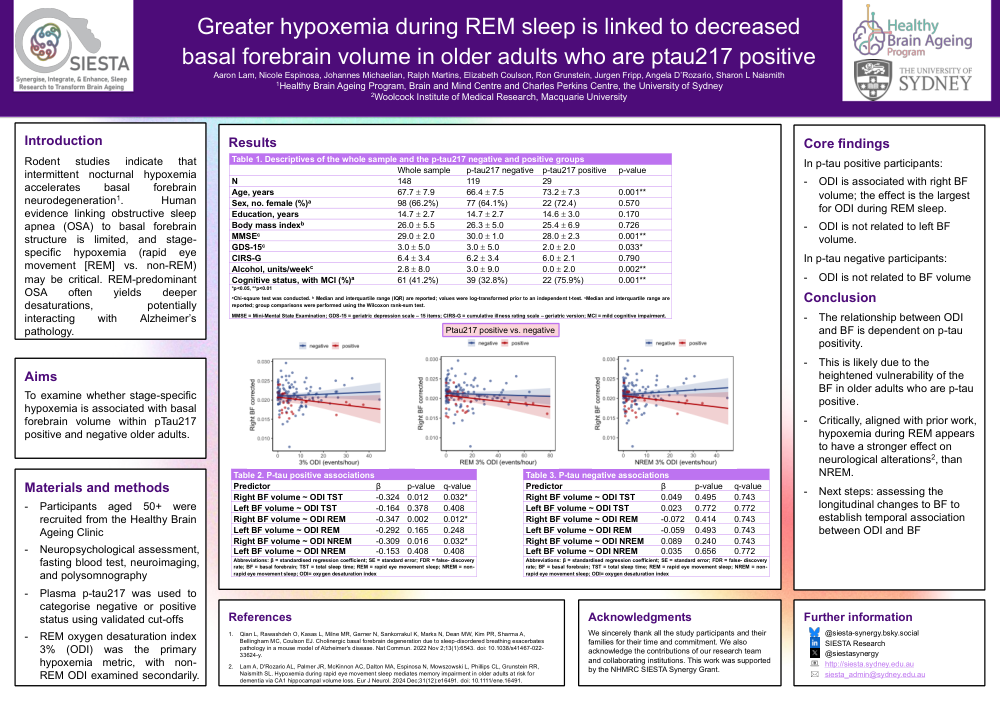
Greater Hypoxemia During Rem Sleep Is Linked To Decreased Basal Forebrain Volume In Older Adults Who Are Ptau217 Positive
Part of Topic
Introduction
Rodent studies indicate that intermittent nocturnal hypoxemia accelerates basal forebrain neurodegeneration1. Human evidence linking obstructive sleep apnea (OSA) to basal forebrain structure is limited, and stage-specific hypoxemia (rapid eye movement [REM] vs. non-REM) may be critical. REM-predominant OSA often yields deeper desaturations, potentially interacting with Alzheimer’s pathology.
Aims
To examine whether stage-specific hypoxemia is associated with basal forebrain volume within pTau217 positive and negative older adults.
Materials and methods
|
Table 1. Descriptives of the whole sample and the p-tau217 negative and positive groups |
||||
|
|
Whole sample |
p-tau217 negative |
p-tau217 positive |
p-value |
|
N |
148 |
119 |
29 |
|
|
Age, years |
67.7 ± 7.9 |
66.4 ± 7.5 |
73.2 ± 7.3 |
0.001** |
|
Sex, no. female (%)a |
98 (66.2%) |
77 (64.1%) |
22 (72.4) |
0.570 |
|
Education, years |
14.7 ± 2.7 |
14.7 ± 2.7 |
14.6 ± 3.0 |
0.170 |
|
Body mass indexb |
26.0 ± 5.5 |
26.3 ± 5.0 |
25.4 ± 6.9 |
0.726 |
|
MMSEc |
29.0 ± 2.0 |
30.0 ± 1.0 |
28.0 ± 2.3 |
0.001** |
|
GDS-15c |
3.0 ± 5.0 |
3.0 ± 5.0 |
2.0 ± 2.0 |
0.033* |
|
CIRS-G |
6.4 ± 3.4 |
6.2 ± 3.4 |
6.0 ± 2.1 |
0.790 |
|
Alcohol, units/weekc |
2.8 ± 8.0 |
3.0 ± 9.0 |
0.0 ± 2.0 |
0.002** |
|
Cognitive status, with MCI (%)a |
61 (41.2%) |
39 (32.8%) |
22 (75.9%) |
0.001** |
|
*p<0.05, **p<0.01 aChi-sqaure test was conducted. b Median and interquartile range (IQR) are reported; values were log-transformed prior to an independent t-test. cMedian and interquartile range are reported; group comparisons were performed using the Wilcoxon rank-sum test. MMSE = Mini-Mental State Examination; GDS-15 = geriatric depression scale – 15 items; CIRS-G = cumulative illness rating scale – geriatric version; MCI = mild cognitive impairment. |
||||
|
Table 2. P-tau positive associations |
|||
|
Predictor |
β |
p-value |
q-value |
|
Right BF volume ~ ODI TST |
-0.324 |
0.012 |
0.032* |
|
Left BF volume ~ ODI TST |
-0.164 |
0.378 |
0.408 |
|
Right BF volume ~ ODI REM |
-0.347 |
0.002 |
0.012* |
|
Left BF volume ~ ODI REM |
-0.292 |
0.165 |
0.248 |
|
Right BF volume ~ ODI NREM |
-0.309 |
0.016 |
0.032* |
|
Left BF volume ~ ODI NREM |
-0.153 |
0.408 |
0.408 |
|
Abbreviations: β = standardised regression coefficient; SE = standard error; FDR = false- discovery rate; BF = basal forebrain; TST = total sleep time; REM = rapid eye movement sleep; NREM = non-rapid eye movement sleep; ODI= oxygen desaturation index |
|||
|
Table 3. P-tau negative associations |
|||
|
Predictor |
β |
p-value |
q-value |
|
Right BF volume ~ ODI TST |
0.049 |
0.495 |
0.743 |
|
Left BF volume ~ ODI TST |
0.023 |
0.772 |
0.772 |
|
Right BF volume ~ ODI REM |
-0.072 |
0.414 |
0.743 |
|
Left BF volume ~ ODI REM |
-0.059 |
0.493 |
0.743 |
|
Right BF volume ~ ODI NREM |
0.089 |
0.240 |
0.743 |
|
Left BF volume ~ ODI NREM |
0.035 |
0.656 |
0.772 |
|
Abbreviations: β = standardised regression coefficient; SE = standard error; FDR = false- discovery rate; BF = basal forebrain; TST = total sleep time; REM = rapid eye movement sleep; NREM = non-rapid eye movement sleep; ODI= oxygen desaturation index |
|||
In p-tau positive participants:
In p-tau negative participants:
Conclusion
Comments
Email is required but is not shown publicly.
Loading comments...