4,068 posters, 219 videos, 101 topics, 69 sessions, 14,365 authors, 6,128 institutions
ePostersLive by SciGen Technologies S.A. All rights reserved.
Alzheimer's Association International Conference 2026
July 12-15, 2026 | London, United Kingdom, and Online

9379
Alzheimer's Disease Risk Prediction Using Systemic Inflammation Markers In The ED
Poster Presenter
Authors
Tianshe He, Rebecca Betensky, Ula Hwang, Chunlei Zheng, Natalia Sifnugel, Ricardo Osorio, Jeffrey Berger, Omonigho Bubu, Thomas Wisniewski, Nhan Do, Nathanael Fillmore, Jaime Ramos Cejudo
Affiliations
Department of Psychiatry, New York University Grossman School of Medicine, New York, New York., Department of Biostatistics, NYU School of Global Public Health, New York, New York, USA, Departments of Emergency Medicine and Population Health, New York University Grossman School of Medicine, New York, New York, USA., VA Boston Cooperative Studies Program, MAVERIC, VA Boston Healthcare System, Boston, Massachusetts, USA, Departments of Medicine and Surgery, NYU Grossman School of Medicine, New York., Center for Cognitive Neurology, Department of Neurology, New York University Grossman School of Medicine, New York, New York., VA Boston Cooperati2 Department of Psychiatry, New York University Grossman School of Medicine, New York, New York.
Part of Topic
BACKGROUND
Systemic inflammation is linked to Alzheimer's disease and related dementias (AD/ADRD)
Markers like neutrophil- and monocyte-to-lymphocyte ratios (NLR, MLR) are associated with AD/ADRD risk¹
In the emergency department (ED), these markers are often transiently elevated due to acute illness, biasing their predictive value
HYPOTHESIS
Incorporating pre-ED trajectories of NLR and MLR will improve AD/ADRD risk prediction
METHODS
Outcomes were assessed starting 3 months post-ED visit over 3–7-year windows.
ED-SIM model using NLR and MLR measurements obtained up to 2 years before the ED visit.
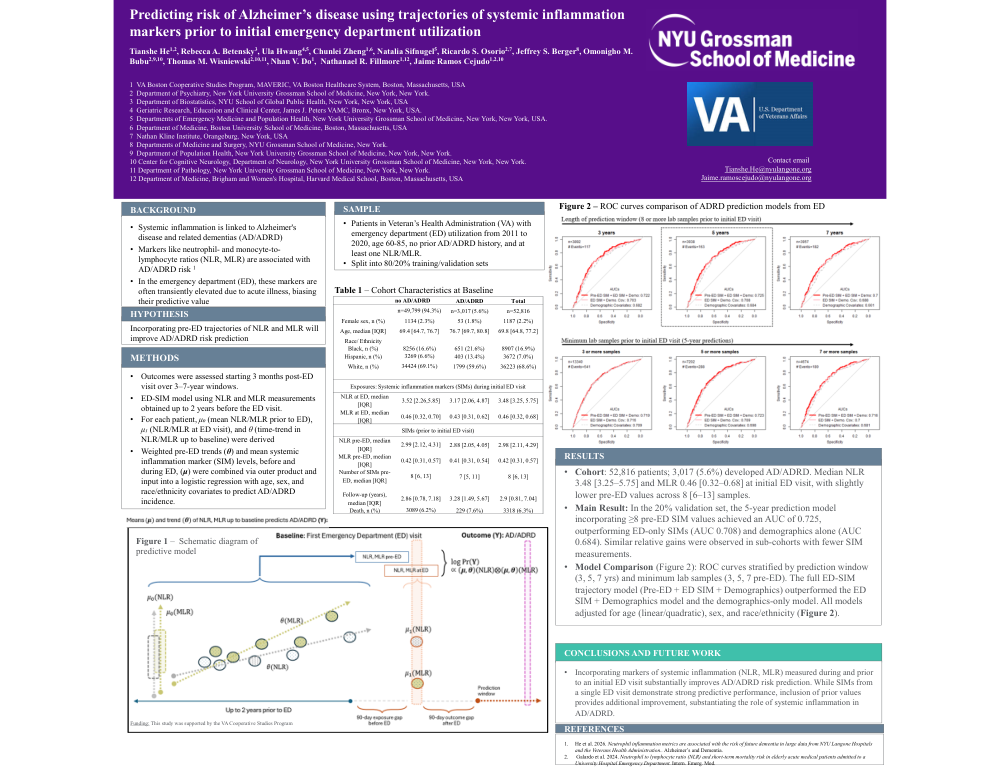
For each patient, μ₀ (mean NLR/MLR prior to ED), μ₁ (NLR/MLR at ED visit), and θ (time-trend in NLR/MLR up to baseline) were derived
Weighted pre-ED trends (θ) and mean systemic inflammation marker (SIM) levels, before and during ED, (μ) were combined via outer product and input into a logistic regression with age, sex, and race/ethnicity covariates to predict AD/ADRD incidence.
SAMPLE
Patients in Veteran's Health Administration (VA) with emergency department (ED) utilization from 2011 to 2020, age 60-85, no prior AD/ADRD history, and at least one NLR/MLR.
Split into 80/20% training/validation sets
RESULTS
Cohort: 52,816 patients; 3,017 (5.6%) developed AD/ADRD. Median NLR 3.48 [3.25–5.75] and MLR 0.46 [0.32–0.68] at initial ED visit, with slightly lower pre-ED values across 8 [6–13] samples.
Main Result: In the 20% validation set, the 5-year prediction model incorporating ≥8 pre-ED SIM values achieved an AUC of 0.725, outperforming ED-only SIMs (AUC 0.708) and demographics alone (AUC 0.684). Similar relative gains were observed in sub-cohorts with fewer SIM measurements.
Model Comparison (Figure 2): ROC curves stratified by prediction window (3, 5, 7 yrs) and minimum lab samples (3, 5, 7 pre-ED). The full ED-SIM trajectory model (Pre-ED + ED SIM + Demographics) outperformed the ED SIM + Demographics model and the demographics-only model. All models adjusted for age (linear/quadratic), sex, and race/ethnicity (Figure 2).
CONCLUSIONS AND FUTURE WORK
Incorporating markers of systemic inflammation (NLR, MLR) measured during and prior to an initial ED visit substantially improves AD/ADRD risk prediction. While SIMs from a single ED visit demonstrate strong predictive performance, inclusion of prior values provides additional improvement, substantiating the role of systemic inflammation in AD/ADRD.
Table 1 – Cohort Characteristics at Baseline
|
Variable |
no AD/ADRD |
AD/ADRD |
Total |
|
n |
49,799 (94.3%) |
3,017 (5.6%) |
52,816 |
|
Female sex, n (%) |
1134 (2.3%) |
53 (1.8%) |
1187 (2.2%) |
|
Age, median [IQR] |
69.4 [64.7, 76.7] |
76.7 [69.7, 80.8] |
69.8 [64.8, 77.2] |
|
Race/Ethnicity |
|
|
|
|
Black, n (%) |
8256 (16.6%) |
651 (21.6%) |
8907 (16.9%) |
|
Hispanic, n (%) |
3269 (6.6%) |
403 (13.4%) |
3672 (7.0%) |
|
White, n (%) |
34424 (69.1%) |
1799 (59.6%) |
36223 (68.6%) |
|
Exposures: SIMs during initial ED visit |
|
|
|
|
NLR at ED, median [IQR] |
3.52 [2.26, 5.85] |
3.17 [2.06, 4.87] |
3.48 [3.25, 5.75] |
|
MLR at ED, median [IQR] |
0.46 [0.32, 0.70] |
0.43 [0.31, 0.62] |
0.46 [0.32, 0.68] |
|
SIMs (prior to initial ED visit) |
|
|
|
|
NLR pre-ED, median [IQR] |
2.99 [2.12, 4.31] |
2.88 [2.05, 4.05] |
2.98 [2.11, 4.29] |
|
MLR pre-ED, median [IQR] |
0.42 [0.31, 0.57] |
0.41 [0.31, 0.54] |
0.42 [0.31, 0.57] |
|
Number of SIMs pre-ED, median [IQR] |
8 [6, 13] |
7 [5, 11] |
8 [6, 13] |
|
Follow-up (years), median [IQR] |
2.86 [0.78, 7.18] |
3.28 [1.49, 5.67] |
2.9 [0.81, 7.04] |
|
Death, n (%) |
3089 (6.2%) |
229 (7.6%) |
3318 (6.3%) |
Figure 1 – Schematic diagram of predictive model
Means (μ) and trend (θ) of NLR, MLR up to baseline predicts AD/ADRD (Y):
Baseline: First Emergency Department (ED) visit
Outcome (Y): AD/ADRD
log Pr(Y) ∝ (μ, θ)(NLR) ⊗ (μ, θ)(MLR)
Variables shown: μ₀(NLR), μ₀(MLR), θ(NLR), θ(MLR), μ₁(NLR), μ₁(MLR)
Timeline: Up to 2 years prior to ED → 90-day exposure gap before ED → 90-day outcome gap after ED → Prediction window
Funding: This study was supported by the VA Cooperative Studies Program
Figure 2 – ROC curves comparison of ADRD prediction models from ED
Length of prediction window (8 or more lab samples prior to initial ED visit):
|
Window |
n |
# Events |
Pre-ED SIM + ED SIM + Demo |
ED SIM + Demo. Cov. |
Demographic Covariates |
|
3 years |
3892 |
117 |
0.722 |
0.703 |
0.682 |
|
5 years |
3938 |
163 |
0.725 |
0.708 |
0.684 |
|
7 years |
3957 |
182 |
0.7 |
0.688 |
0.661 |
Minimum lab samples prior to initial ED visit (5-year predictions):
|
Samples |
n |
# Events |
Pre-ED SIM + ED SIM + Demo |
ED SIM + Demo. Cov. |
Demographic Covariates |
|
3 or more |
13340 |
541 |
0.719 |
0.716 |
0.709 |
|
5 or more |
7202 |
288 |
0.723 |
0.709 |
0.698 |
|
7 or more |
4674 |
189 |
0.716 |
0.7 |
0.681 |
REFERENCES
Comments
Email is required but is not shown publicly.
Loading comments...