4,068 posters, 219 videos, 101 topics, 69 sessions, 14,365 authors, 6,128 institutions
ePostersLive by SciGen Technologies S.A. All rights reserved.
Alzheimer's Association International Conference 2026
July 12-15, 2026 | London, United Kingdom, and Online

3130
Disentangling Brain-region Specific From Global Brain-wide Microglial Responses To Pathologies Of Alzheimer’s Disease
Poster Presenter
Authors
Amy Watt, David Fardo, Suman Jayadev, Katherine Prater, Shubhabrata Mukherjee, Kevin Lin
Affiliations
Part of Topic
Disentangling brain-region specific from global brain-wide microglial responses to pathologies of Alzheimer’s disease
Amy Watt1, David Fardo2, Suman Jayadev3, Katherine E. Prater3, Shubhabrata Mukherjee4, Kevin Z. Lin1
-
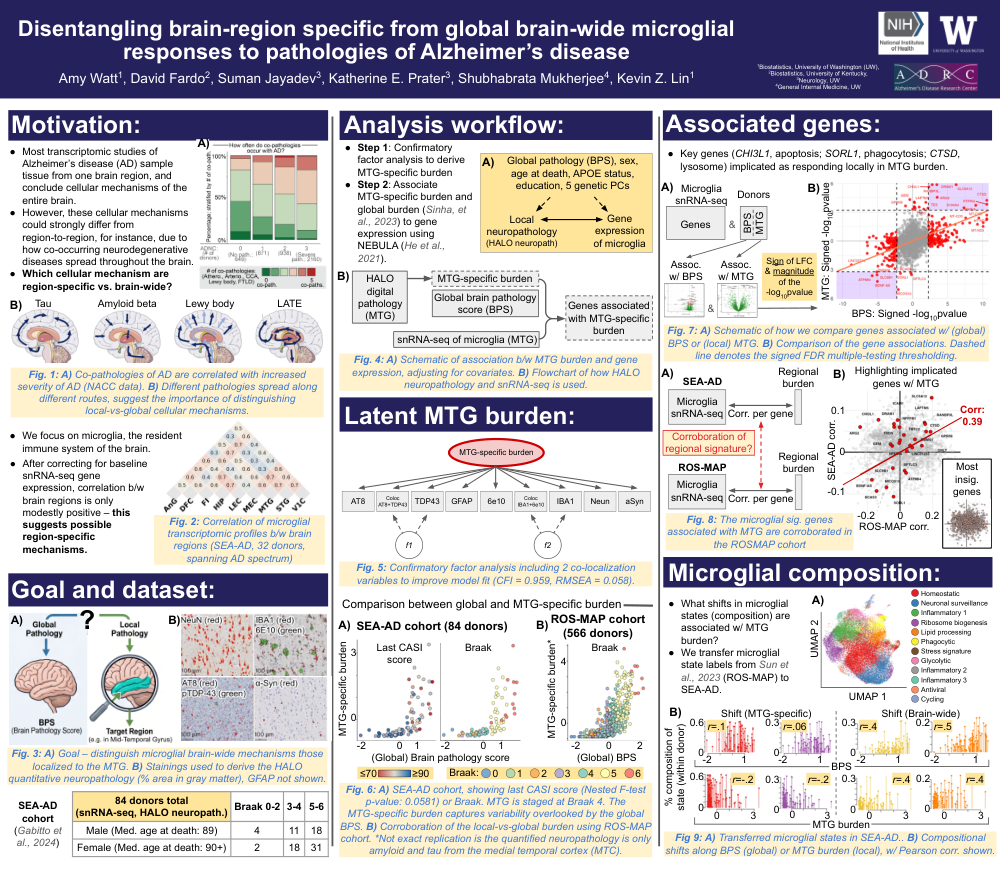
Most transcriptomic studies of Alzheimer’s disease (AD) sample tissue from one brain region, and conclude cellular mechanisms of the entire brain.
-
However, these cellular mechanisms could strongly differ from region-to-region, for instance, due to how co-occurring neurodegenerative diseases spread throughout the brain.
-
Which cellular mechanism are region-specific vs. brain-wide?
-
We focus on microglia, the resident immune system of the brain.
-
After correcting for baseline snRNA-seq gene expression, correlation b/w brain regions is only modestly positive – this suggests possible region-specific mechanisms.
Fig. 1: A) Co-pathologies of AD are correlated with increased severity of AD (NACC data). B) Different pathologies spread along different routes, suggest the importance of distinguishing local-vs-global cellular mechanisms.
Fig. 2: Correlation of microglial transcriptomic profiles b/w brain regions (SEA-AD, 32 donors, spanning AD spectrum)
Goal and dataset:
Fig. 3: A) Goal – distinguish microglial brain-wide mechanisms those localized to the MTG. B) Stainings used to derive the HALO quantitative neuropathology (% area in gray matter), GFAP not shown.
Analysis workflow:
-
Step 1: Confirmatory factor analysis to derive MTG-specific burden
-
Step 2: Associate MTG-specific burden and global burden (Sinha, et al., 2023) to gene expression using NEBULA (He et al., 2021).
Latent MTG burden:
Fig. 5: Confirmatory factor analysis including 2 co-localization variables to improve model fit (CFI = 0.959, RMSEA = 0.058).
Fig. 6: A) SEA-AD cohort, showing last CASI score (Nested F-test p-value: 0.0581) or Braak. MTG is staged at Braak 4. The MTG-specific burden captures variability overlooked by the global BPS. B) Corroboration of the local-vs-global burden using ROS-MAP cohort. *Not exact replication is the quantified neuropathology is only amyloid and tau from the medial temporal cortex (MTC).
Associated genes:
-
Key genes (CHI3L1, apoptosis; SORL1, phagocytosis; CTSD, lysosome) implicated as responding locally in MTG burden.
Fig. 7: A) Schematic of how we compare genes associated w/ (global) BPS or (local) MTG. B) Comparison of the gene associations. Dashed line denotes the signed FDR multiple-testing thresholding.
Fig. 8: The microglial sig. genes associated with MTG are corroborated in the ROSMAP cohort
Microglial composition:
-
What shifts in microglial states (composition) are associated w/ MTG burden?
-
We transfer microglial state labels from Sun et al., 2023 (ROS-MAP) to SEA-AD.
Fig 9: A) Transferred microglial states in SEA-AD.. B) Compositional shifts along BPS (global) or MTG burden (local), w/ Pearson corr. shown.
Comments
Email is required but is not shown publicly.
Loading comments...