4,068 posters, 219 videos, 101 topics, 69 sessions, 14,365 authors, 6,128 institutions
ePostersLive by SciGen Technologies S.A. All rights reserved.
Alzheimer's Association International Conference 2026
July 12-15, 2026 | London, United Kingdom, and Online

9362
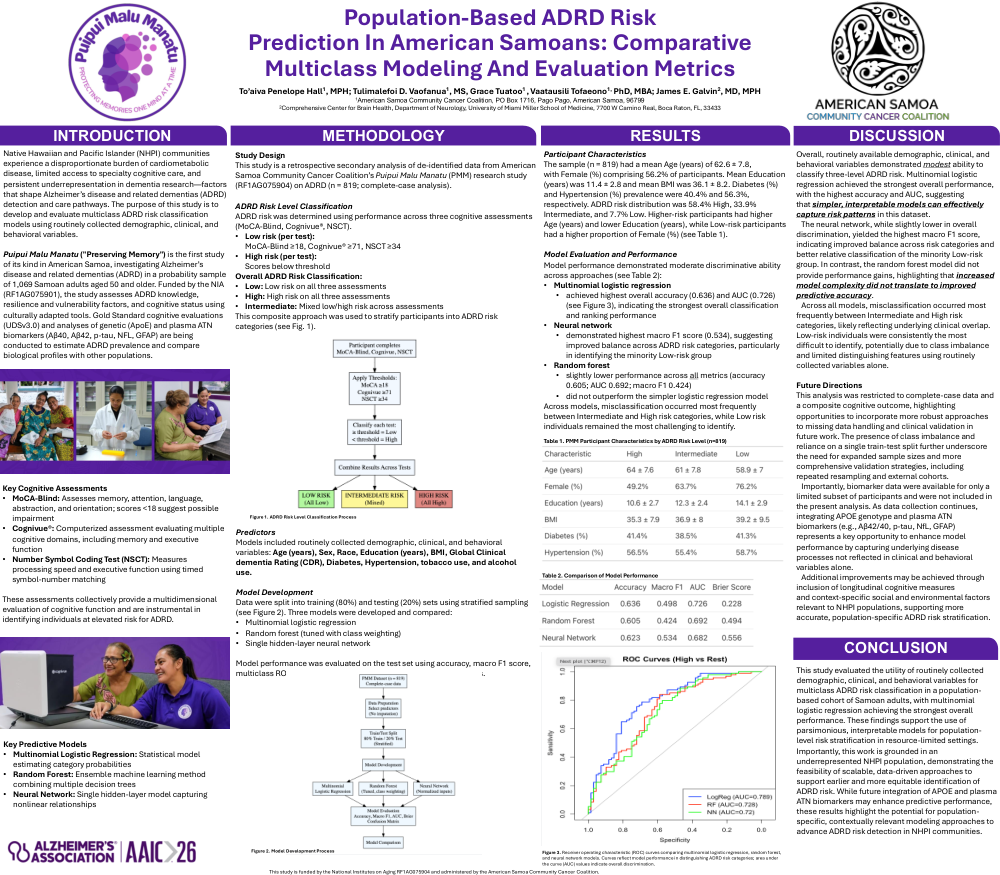
Population-Based ADRD Risk Prediction In American Samoans: Comparative Multiclass Modeling And Evaluation Metrics
Poster Presenter
Authors
To'aiva Penelope Hall, Tulimalefoi D. Vaofanua, Grace D. Tuatoo, Vaatausili Tofaeono, James E. Galvin
Affiliations
Part of Topic
Population-Based ADRD Risk Prediction In American Samoans: Comparative Multiclass Modeling And Evaluation Metrics
To’aiva Penelope Hall1, MPH; Tulimalefoi D. Vaofanua1, MS, Grace Tuatoo1 , Vaatausili Tofaeono1, PhD, MBA; James E. Galvin2, MD, MPH
1American Samoa Community Cancer Coalition, PO Box 1716, Pago Pago, American Samoa, 96799
2Comprehensive Center for Brain Health, Department of Neurology, University of Miami Miller School of Medicine, 7700 W Camino Real, Boca Raton, FL, 33433
INTRODUCTION
Native Hawaiian and Pacific Islander (NHPI) communities experience a disproportionate burden of cardiometabolic disease, limited access to specialty cognitive care, and persistent underrepresentation in dementia research—factors that shape Alzheimer’s disease and related dementias (ADRD) detection and care pathways. The purpose of this study is to develop and evaluate multiclass ADRD risk classification models using routinely collected demographic, clinical, and behavioral variables.
Puipui Malu Manatu ("Preserving Memory") is the first study of its kind in American Samoa, investigating Alzheimer’s disease and related dementias (ADRD) in a probability sample of 1,069 Samoan adults aged 50 and older. Funded by the NIA (RF1AG075901), the study assesses ADRD knowledge, resilience and vulnerability factors, and cognitive status using culturally adapted tools. Gold Standard cognitive evaluations (UDSv3.0) and analyses of genetic (ApoE) and plasma ATN biomarkers (Aβ40, Aβ42, p-tau, NFL, GFAP) are being conducted to estimate ADRD prevalence and compare biological profiles with other populations.
Key Cognitive Assessments
These assessments collectively provide a multidimensional evaluation of cognitive function and are instrumental in identifying individuals at elevated risk for ADRD.
Key Predictive Models
METHODOLOGY
Study Design
This study is a retrospective secondary analysis of de‑identified data from American Samoa Community Cancer Coalition’s Puipui Malu Manatu (PMM) research study (RF1AG075904) on ADRD (n = 819; complete-case analysis).
ADRD Risk Level Classification
ADRD risk was determined using performance across three cognitive assessments (MoCA‑Blind, Cognivue®, NSCT).
MoCA‑Blind ≥18, Cognivue® ≥71, NSCT ≥34
Scores below threshold
Overall ADRD Risk Classification:
This composite approach was used to stratify participants into ADRD risk categories (see Fig. 1).
Figure 1. ADRD Risk Level Classification Process
Predictors
Models included routinely collected demographic, clinical, and behavioral variables: Age (years), Sex, Race, Education (years), BMI, Global Clinical dementia Rating (CDR), Diabetes, Hypertension, tobacco use, and alcohol use.
Model Development
Data were split into training (80%) and testing (20%) sets using stratified sampling (see Figure 2). Three models were developed and compared:
Model performance was evaluated on the test set using accuracy, macro F1 score, multiclass ROC AUC (Hand–Till), Brier score, and confusion matrices.
Figure 2. Model Development Process
RESULTS
Participant Characteristics
The sample (n = 819) had a mean Age (years) of 62.6 ± 7.8, with Female (%) comprising 56.2% of participants. Mean Education (years) was 11.4 ± 2.8 and mean BMI was 36.1 ± 8.2. Diabetes (%) and Hypertension (%) prevalence were 40.4% and 56.3%, respectively. ADRD risk distribution was 58.4% High, 33.9% Intermediate, and 7.7% Low. Higher-risk participants had higher Age (years) and lower Education (years), while Low-risk participants had a higher proportion of Female (%) (see Table 1).
Model Evaluation and Performance
Model performance demonstrated moderate discriminative ability across approaches (see Table 2):
Across models, misclassification occurred most frequently between Intermediate and High risk categories, while Low risk individuals remained the most challenging to identify.
Table 1. PMM Participant Characteristics by ADRD Risk Level (n=819)
Table 2. Comparison of Model Performance
Figure 3. Receiver operating characteristic (ROC) curves comparing multinomial logistic regression, random forest, and neural network models. Curves reflect model performance in distinguishing ADRD risk categories; area under the curve (AUC) values indicate overall discrimination.
DISCUSSION
Overall, routinely available demographic, clinical, and behavioral variables demonstrated modest ability to classify three-level ADRD risk. Multinomial logistic regression achieved the strongest overall performance, with the highest accuracy and AUC, suggesting that simpler, interpretable models can effectively capture risk patterns in this dataset.
The neural network, while slightly lower in overall discrimination, yielded the highest macro F1 score, indicating improved balance across risk categories and better relative classification of the minority Low-risk group. In contrast, the random forest model did not provide performance gains, highlighting that increased model complexity did not translate to improved predictive accuracy.
Across all models, misclassification occurred most frequently between Intermediate and High risk categories, likely reflecting underlying clinical overlap. Low-risk individuals were consistently the most difficult to identify, potentially due to class imbalance and limited distinguishing features using routinely collected variables alone.
Future Directions
This analysis was restricted to complete-case data and a composite cognitive outcome, highlighting opportunities to incorporate more robust approaches to missing data handling and clinical validation in future work. The presence of class imbalance and reliance on a single train-test split further underscore the need for expanded sample sizes and more comprehensive validation strategies, including repeated resampling and external cohorts.
Importantly, biomarker data were available for only a limited subset of participants and were not included in the present analysis. As data collection continues, integrating APOE genotype and plasma ATN biomarkers (e.g., Aβ42/40, p‑tau,NfL, GFAP) represents a key opportunity to enhance model performance by capturing underlying disease processes not reflected in clinical and behavioral variables alone.
Additional improvements may be achieved through inclusion of longitudinal cognitive measures and context-specific social and environmental factors relevant to NHPI populations, supporting more accurate, population-specific ADRD risk stratification.
CONCLUSION
This study evaluated the utility of routinely collected demographic, clinical, and behavioral variables for multiclass ADRD risk classification in a population-based cohort of Samoan adults, with multinomial logistic regression achieving the strongest overall performance. These findings support the use of parsimonious, interpretable models for population-level risk stratification in resource-limited settings.
Importantly, this work is grounded in an underrepresented NHPI population, demonstrating the feasibility of scalable, data-driven approaches to support earlier and more equitable identification of ADRD risk. While future integration of APOE and plasma ATN biomarkers may enhance predictive performance, these results highlight the potential for population-specific, contextually relevant modeling approaches to advance ADRD risk detection in NHPI communities.
This study is funded by the National Institutes on Aging RF1AG075904 and administered by the American Samoa Community Cancer Coalition.
Comments
Email is required but is not shown publicly.
Loading comments...