4,068 posters, 219 videos, 101 topics, 69 sessions, 14,365 authors, 6,128 institutions
ePostersLive by SciGen Technologies S.A. All rights reserved.
Alzheimer's Association International Conference 2026
July 12-15, 2026 | London, United Kingdom, and Online

9479
County Level Comparison Of Geographic Adrd Disparity By Population Source
Poster Presenter
Authors
Affiliations
Part of Topic
Background: Using population prevalence estimates based off estimation from a single urban study may not correctly capture Alzheimer’s disease and related dementias (ADRD) prevalence disparities based on geography. Applying urban models to rural areas may systematically over/underestimate ADRD prevalence. We sought to compare county-level geographic disparities between a single population-based estimate and claims-based ADRD prevalences in the US.
Methods: 2020 national county-level ADRD prevalence estimates from the Chicago Healthy Aging Project (CHAP) ADRD Mapping Tool and Centers for Medicare and Medicaid Services estimates from the 2018 Chronic Conditions Warehouse geographic variation public use file (CMS) were considered. Prevalence estimates were compared using linear regression models containing source (CHAP or CMS), geographic variation (rural and Appalachian designations), and their interaction, both unadjusted and adjusted for county-level distributions of sex, race, age >85, life expectancy, and area deprivation index (ADI). Value of interest is the difference in disparity measures (e.g., rural vs. urban) rather than the individual estimates themselves.
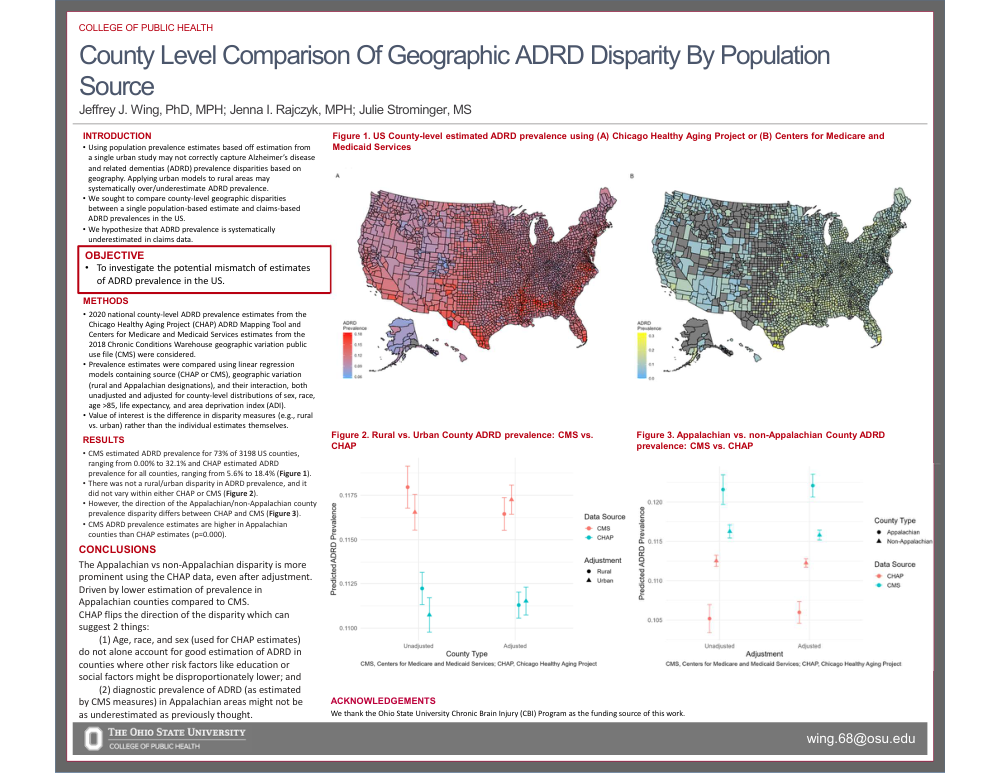
Results: CMS estimated ADRD prevalence for 73% of 3198 US counties, ranging from 0.00% to 32.1% and CHAP estimated ADRD prevalence for all counties, ranging from 5.6% to 18.4% (Figure 1). There was not a rural/urban disparity in ADRD prevalence, and it did not vary within either CHAP or CMS (Figure 2). However, the direction of the Appalachian/non-Appalachian county prevalence disparity differs between CHAP and CMS (Figure 3); as CMS ADRD prevalence estimates are higher in Appalachian counties than CHAP estimates (p=0.000).
Conclusions: Even after adjustment for sex, race, age, life expectancy, and ADI, the Appalachian vs non-Appalachian disparity is more prominent using the CHAP data. This is driven by lower estimation of the prevalence in Appalachian counties compared to CMS estimates. CHAP flips the direction of the disparity which can suggest 2 things: (1) Age, race, and sex (used for CHAP estimates) do not alone account for good estimation of ADRD in counties where other risk factors like education or social factors might be disproportionately lower; and (2) the diagnostic prevalence of ADRD (as estimated by CMS measures) in Appalachian areas might not be as underestimated as previously thought.
Comments
Email is required but is not shown publicly.
Loading comments...