4,068 posters, 219 videos, 101 topics, 69 sessions, 14,365 authors, 6,128 institutions
ePostersLive by SciGen Technologies S.A. All rights reserved.
Alzheimer's Association International Conference 2026
July 12-15, 2026 | London, United Kingdom, and Online

6457
Data-driven Subgrouping Of Individuals On Alzheimer’s Continuum Based On Amyloid-ί Aggregation
Poster Presenter
Part of Topic
Data-driven subgrouping of individuals on Alzheimer’s continuum based on amyloid-β aggregation
Arina A. Tagmazian1, Esa Pitkänen1, Eero Vuoksimaa1
1 Institute for Molecular Medicine Finland (FIMM), HiLIFE, University of Helsinki, Finland
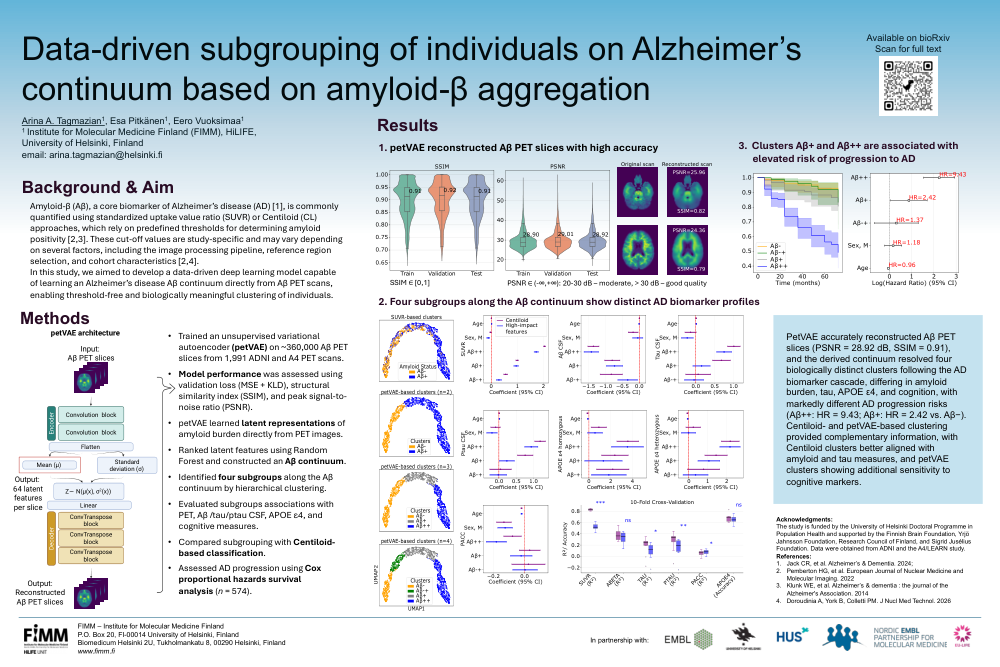
Amyloid positron emission tomography (PET) scans are used to define amyloid-β (Aβ) accumulation, the core biomarker of Alzheimer’s disease (AD). Typically, individuals are classified as either Aβ-negative or Aβ-positive. However, in this study, we aimed to identify subgroups along the AD continuum of Aβ accumulation based on PET scans. This approach may enable a more nuanced characterization of amyloid pathology and could support earlier detection of AD.
We analyzed 3,110 Aβ PET scans obtained from the ADNI and A4 cohorts to develop petVAE, a variational autoencoder for two-dimensional slices of PET images. The model was trained to reconstruct Aβ PET images directly, without using diagnostic labels or restricting the data by scanner type or predefined regions of interest. From each scan, petVAE generated a latent representation consisting of 11,648 features, which were subsequently used for visualization, exploratory analysis, and clustering of individuals across the AD spectrum.
We found four clusters differed significantly in standardized uptake value ratio (p < 1.64×10⁻⁸) and cerebrospinal fluid (CSF) Aβ levels (p < 0.02), indicating that petVAE effectively positions scans along a continuous Aβ trajectory. Two clusters (Aβ- and Aβ-+) were largely amyloid-negative, while the remaining two (Aβ+ and Aβ++) were predominantly amyloid-positive. The clusters representing the extremes of the continuum (Aβ- and Aβ++) aligned with the conventional Aβ− and Aβ+ categories and showed marked differences in cognitive performance, APOE ε4 carrier frequency, and Aβ, Tau and phosphorylated Tau CSF biomarkers (p < 3×10⁻⁶). Individuals in the intermediate clusters (Aβ-+ and Aβ+) had significantly higher odds of carrying at least one APOE ε4 allele compared to the Aβ- group (p < 0.026). Moreover, participants classified into Aβ+ or Aβ++ cluster demonstrated a substantially increased risk of progression to AD over the 6-year follow-up period (Hazard ratio’s = 2.42 and 9.43 for groups Aβ+ and Aβ++, respectively, p < 1.17×10⁻⁷).
Overall, petVAE achieved accurate PET image reconstruction and also learned latent representations that captured biologically meaningful variation along the AD continuum. By identifying subtle patterns of Aβ pathology, this framework supports early detection of preclinical disease stages and provides a data-driven approach for investigating AD.
Comments
Email is required but is not shown publicly.
Loading comments...