4,068 posters, 219 videos, 101 topics, 69 sessions, 14,365 authors, 6,128 institutions
ePostersLive by SciGen Technologies S.A. All rights reserved.
Alzheimer's Association International Conference 2026
July 12-15, 2026 | London, United Kingdom, and Online

1403
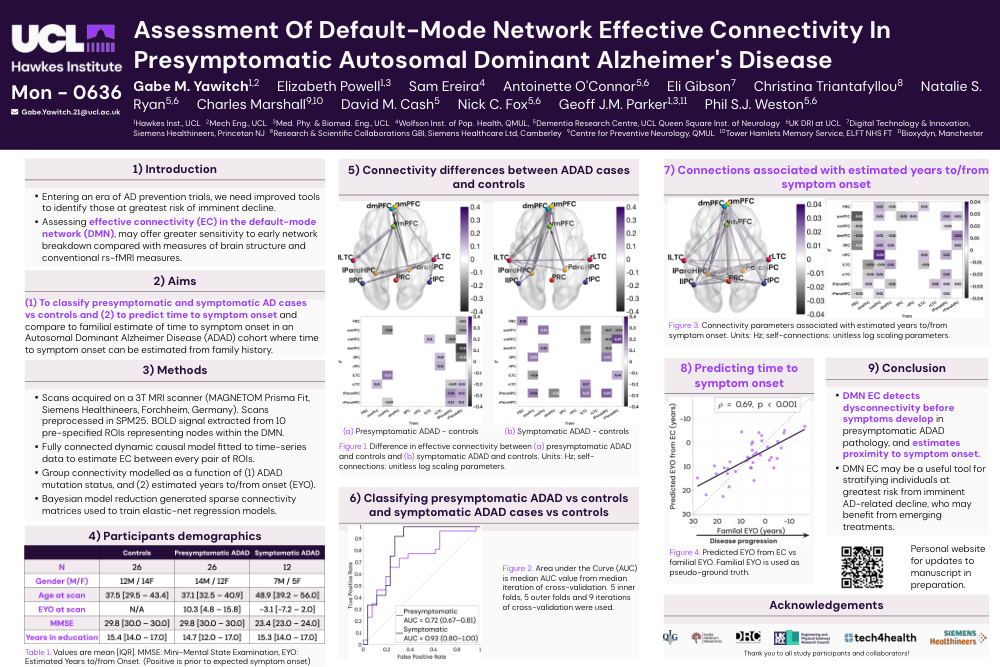
Assessment Of Default-mode Network Effective Connectivity In Presymptomatic Autosomal Dominant Alzheimer's Disease
Poster Presenter
Authors
Part of Topic
% Gemini theme
% https://github.com/anishathalye/gemini
\documentclass[final]{beamer}
\usepackage[none]{hyphenat}
% ====================
% Packages
% ====================
\usepackage{fontspec}
\usepackage[size=custom,width=90,height=60,scale=1.0]{beamerposter}
\usetheme{gemini}
\usecolortheme{UCLGemini}
\usepackage{graphicx}
\usepackage{booktabs}
\usepackage{tikz}
\usepackage{pgfplots}
\pgfplotsset{compat=1.14}
\usepackage{anyfontsize}
\usepackage{fontawesome5}
\usepackage{subcaption}
\captionsetup{font=small}
% ====================
% Fonts
% ====================
\setsansfont{UCL Sans}[
UprightFont=*-Light,
ItalicFont=*-LightItalic,
BoldFont=*-Bold,
BoldItalicFont=*-BoldItalic
]
\renewcommand{\familydefault}{\sfdefault}
% ====================
% Lengths
% ====================
% If you have N columns, choose \sepwidth and \colwidth such that
% (N+1)*\sepwidth + N*\colwidth = \paperwidth
\newlength{\sepwidth}
\setlength{\sepwidth}{0.025\paperwidth}
\newlength{\colwidth}
\setlength{\colwidth}{0.3\paperwidth}
\newlength{\middlecolwidth}
\setlength{\middlecolwidth}{0.3\paperwidth}
\newlength{\rightcolwidth}
\setlength{\rightcolwidth}{\paperwidth - 3\sepwidth - \colwidth - \middlecolwidth}
\newcommand{\separatorcolumn}{\begin{column}{\sepwidth}\end{column}}
% ====================
% Title
% ====================
\title{Assessment Of Default-Mode Network Effective Connectivity In Presymptomatic Autosomal Dominant Alzheimer's Disease}
\author[G. Yawitch et al.]{\textbf{Gabe M. Yawitch}\inst{1,2} \quad Elizabeth Powell\inst{1,3} \and Sam Ereira\inst{4} \and Antoinette O'Connor\inst{5,6} \and Eli Gibson\inst{7} \and Christina Triantafyllou\inst{8} \and Natalie S. Ryan\inst{5,6} \and Charles Marshall\inst{9,10} \and David M. Cash\inst{5} \and Nick C. Fox\inst{5,6} \and Geoff J.M. Parker\inst{1,3,11} \and Phil S.J. Weston\inst{5,6}}
\institute[QIG, UCL]{\inst{1} Hawkes Inst., UCL \, \inst{2} Mech Eng., UCL \, \inst{3} Med. Phy. \& Biomed. Eng., UCL \, \inst{4} Wolfson Inst. of Pop. Health, QMUL,\, \inst{5} Dementia Research Centre, UCL Queen Square Inst. of Neurology \, \inst{6} UK DRI at UCL \, \inst{7} Digital Technology \& Innovation, Siemens Healthineers, Princeton NJ \, \inst{8} Research \& Scientific Collaborations GBI, Siemens Healthcare Ltd, Camberley \, \inst{9} Centre for Preventive Neurology, QMUL \, \inst{10} Tower Hamlets Memory Service, ELFT NHS FT \, \inst{11} Bioxydyn, Manchester}
% ====================
% Footer (optional)
% ====================
% Set variable for images height within footer
\newlength{\footerimageheight}
\setlength{\footerimageheight}{1.5cm}
% \footercontent{
% \includegraphics[height=\footerimageheight]{Images/logos/QIG_logo.png}\hfill
% \includegraphics[height=\footerimageheight]{Images/logos/fad_logo-modified.png}\hfill
% \includegraphics[height=\footerimageheight]{Images/logos/drc-ucl-logo.png}\hfill
% \includegraphics[height=\footerimageheight]{Images/logos/EPSRC_logo.png}\hfill
% \includegraphics[height=\footerimageheight]{Images/logos/Tech4health logo.png}\hfill
% \includegraphics[height=\footerimageheight]{Images/logos/Siemens_Healthineers_logo.svg.png} \hfill
% %placeholder for qrcode and text explaining it
% \includegraphics[height=0.3\footerimageheight]{Images/logos/Siemens_Healthineers_logo.svg.png}\hfill
% \parbox[t]{0.2\textwidth}{\centering\footnotesize{ links to the full paper and code repository.}}
% }
% ====================
% Logo (optional)
% ====================
% use this to include logos on the left and/or right side of the header:
% \logoright{\includegraphics[height=7cm]{logo1.pdf}}
\logoleft{\vspace{-10pt}\parbox[t]{6cm}{\centering
\includegraphics[width=10cm]{Images/logos/UCL_Logo_Hawkes.png}\\[5ex]
\resizebox{10cm}{!}{%
\sffamily\bfseries\color{uclwhite}Mon - 0636%
}
\\[4ex]
\resizebox{10cm}{!}{%
\faEnvelope\, \textbf{Gabe.Yawitch.21@ucl.ac.uk}
}
}}
% \logoleft{%
% \includegraphics[height=3.5cm]{Images/logos/UCL_Logo_Hawkes.png}\\[7.5ex]%
% {\fontsize{3cm}{3.5cm}\selectfont\sffamily\bfseries\color{uclwhite}\#1403}%
% }
\setlogoleftwidth{12cm}
% ====================
% Body
% ====================
\begin{document}
\begin{frame}[t]
\begin{columns}[t]
\separatorcolumn
\begin{column}{\colwidth}
\vspace{-0.5cm}
\begin{block}{1) Introduction}
\begin{itemize}
\item Entering an era of AD prevention trials, we need improved tools to identify those at greatest risk of imminent decline.
\item Assessing \textbf{\textcolor{uclviolet}{effective connectivity (EC) in the default-mode network (DMN)}}, may offer greater sensitivity to early network breakdown compared with measures of brain structure and conventional rs-fMRI measures.
\end{itemize}
\end{block}
\vspace{-0.5cm}
\begin{block}{2) Aims}
\hyphenpenalty=1000\textbf{\textcolor{uclviolet}{ (1) To classify presymptomatic and symptomatic AD cases vs controls and (2) to predict time to symptom onset}} and compare to familial estimate of time to symptom onset in an \mbox{Autosomal Dominant} Alzheimer Disease (ADAD) cohort where time to symptom onset can be estimated from family history.
\end{block}
\vspace{-0.5cm}
\begin{block}{3) Methods}
\begin{itemize}
\item Scans acquired on a 3T MRI scanner (MAGNETOM Prisma Fit, Siemens Healthineers, Forchheim, Germany). Scans preprocessed in SPM25. BOLD signal extracted from 10 pre-specified ROIs representing nodes within the DMN.
\item Fully connected dynamic causal model fitted to time-series data to estimate EC between every pair of ROIs.
\item Group connectivity modelled as a function of (1) ADAD mutation status, and (2) estimated years to/from onset (EYO).
\item Bayesian model reduction generated sparse connectivity matrices used to train elastic-net regression models.
\end{itemize}
\end{block}
\vspace{-0.5cm}
\begin{block}{4) Participants demographics}
\vspace{-0.75cm}
\begin{table}
\centering
\includegraphics[width=\textwidth]{Images/demographic_table.png}
\caption{Values are mean [IQR]. MMSE: Mini-Mental State Examination, EYO: Estimated Years to/from Onset. (Positive is prior to expected symptom onset)}
\label{tab:demographics}
\end{table}
\end{block}
\end{column}
\separatorcolumn
\begin{column}{\middlecolwidth+\rightcolwidth}
\begin{columns}[t]
\begin{column}{\middlecolwidth}
\vspace{-1.5cm}
\begin{block}{5) Connectivity differences between ADAD cases and controls}
\begin{figure}
\centering
\begin{subfigure}[t]{0.48\textwidth}
\centering
\includegraphics[width=\textwidth]{Images/class_presymp_ax.png}
\includegraphics[width=\textwidth]{Images/Classifier_Presymptomatic_Connectivity_Matrix.png}
\caption{Presymptomatic ADAD - controls}
\end{subfigure}% <- This gets rid of the space between the two subfigures
\hfill% <-- This gets rid of the space between the two subfigures
\begin{subfigure}[t]{0.48\textwidth}
\includegraphics[width=\textwidth]{Images/class_symp_ax.png}
\includegraphics[width=\textwidth]{Images/Classifier_Symptomatic_Connectivity_Matrix.png}
\centering
\caption{Symptomatic ADAD - controls}
\end{subfigure}
\caption{Difference in effective connectivity between \textcolor{uclviolet}{(a)} presymptomatic ADAD and controls and \textcolor{uclviolet}{(b)} symptomatic ADAD and controls. Units: Hz; self- connections: unitless log scaling parameters.}
\end{figure}
\end{block}
\begin{block}{6) Classifying presymptomatic ADAD vs controls and symptomatic ADAD cases vs controls}
\begin{columns}
\begin{column}{0.5\textwidth}
\begin{figure}
\centering
\includegraphics[height=12cm]{Images/combined_ROC.png}
\end{figure}
\end{column}
\begin{column}{0.45\textwidth}
\begin{figure}[t]
\centering
\caption{Area under the Curve (AUC) is median AUC value from median iteration of cross-validation. 5 inner folds, 5 outer folds and 9 iterations of cross-validation were used.}
\end{figure}
\end{column}
\end{columns}
\end{block}
\end{column}
\separatorcolumn
\begin{column}{\rightcolwidth}
\vspace{-1.5cm}
\begin{alertblock}{7) Connections associated with estimated years to/from symptom onset}
\begin{figure}
\begin{subfigure}[t]{0.48\textwidth}
\centering
\includegraphics[width=\textwidth]{Images/prog_ax.png}
\end{subfigure}% <- This gets rid of the space between the two subfigures
\hfill% <-- This gets rid of the space between the two subfigures
\centering
\begin{subfigure}[t]{0.48\textwidth}
\includegraphics[width=\textwidth]{Images/Prognosticator_Association_Connectivity_Matrix.png}
\centering
\end{subfigure}
\caption{Connectivity parameters associated with estimated years to/from symptom onset. Units: Hz; self-connections: unitless log scaling parameters.}
\end{figure}
\end{alertblock}
\begin{columns}
\begin{column}{0.46\textwidth}
\begin{alertblock}{8) Predicting time to symptom onset}
\begin{figure}
\centering
\includegraphics[
width=\linewidth,
trim={0cm 0cm 0cm 0cm}, % left bottom right top
clip
]{Images/EC_EYO_Association_Scatter.png}
\caption{Predicted EYO from EC vs familial EYO. Familial EYO is used as pseudo-ground truth.}
\end{figure}
\end{alertblock}
\end{column}
\begin{column}{0.5\textwidth}
\vspace{-0.4cm}
\begin{block}{9) Conclusion}
\begin{itemize}
\item \textbf{\textcolor{uclviolet}{DMN EC detects dysconnectivity before symptoms develop}} in presymptomatic ADAD pathology, and \textbf{\textcolor{uclviolet}{estimates proximity to symptom onset.}}
\item DMN EC may be a useful tool for stratifying individuals at greatest risk from imminent AD-related decline, who may benefit from emerging treatments.
\end{itemize}
\end{block}
\begin{columns}
\begin{column}{0.5\textwidth}
\centering
\includegraphics[height=4cm]{Images/qr_code.png}
\end{column}
\begin{column}{0.5\textwidth}
\centering
\raggedright{Personal website for updates to manuscript in preparation.}
\end{column}
\end{columns}
\end{column}
\end{columns}
\begin{block}{Acknowledgements}
\vspace{1cm}
% Set variable for image width to be used in the footer
\newlength{\imageackheight}
\setlength{\imageackheight}{1.25cm}
% \parbox[t]{\textwidth}{\centering
\includegraphics[height=\imageackheight]{Images/logos/QIG_logo.png}\hfill
\includegraphics[height=\imageackheight]{Images/logos/fad_logo-modified.png}\hfill
\includegraphics[height=\imageackheight]{Images/logos/drc-ucl-logo.png}\hfill
\includegraphics[height=\imageackheight]{Images/logos/EPSRC_logo.png}\hfill
\includegraphics[height=\imageackheight]{Images/logos/Tech4health logo.png}\hfill
\includegraphics[height=\imageackheight]{Images/logos/Siemens_Healthineers_logo.svg.png} \hfill
% }
%placeholder for qrcode and text explaining it
% \includegraphics[height=\footerimageheight]{Images/qr_code.png}\hfill
\vspace{-0.5cm}
\parbox[t]{\textwidth}{\centering\footnotesize{Thank you to all study participants and collaborators!}}
\end{block}
\end{column}
\end{columns}
\end{column}
\separatorcolumn
\end{columns}
\end{frame}
\end{document}
Comments
Email is required but is not shown publicly.
Loading comments...