4,068 posters, 219 videos, 101 topics, 69 sessions, 14,365 authors, 6,128 institutions
ePostersLive by SciGen Technologies S.A. All rights reserved.
Alzheimer's Association International Conference 2026
July 12-15, 2026 | London, United Kingdom, and Online

4747
Brain Age Gap Estimate As A Predictor Of Symptom Onset In Genetic Frontotemporal Dementia
Poster Presenter
Authors
Erin Drazich-Taylor, Martina Bocchetta, Arabella Bouzigues, Eve Ferry-Bolder, Eva Cullen, Lucy Russell, Phoebe Foster, John Van Swieten, Lize Jiskoot, Harro Seelaar, Raquel Sánchez-Valle, Robert Laforce, Caroline Graff, Daniela Galimberti, Rik Vandenberghe, Alexandre de Mendonça, Isabel Santana, Alexander Gerhard, Johannes Levin, Markus Otto, Thibaud Lebouvier, Maxime Bertoux, Simom Ducharme, Isabelle Le Ber, Elizabeth Finger, Maria Carmela Tartaglia, Mario Masellis, Matthis Synofzik, Fermin Moreno, Barbara Borroni, James Rowe, James Cole, Jonathan Rohrer, David Cash, Genetic FTD Initiative
Affiliations
, UCL Queen Square Institute of Neurology, London, UK, Department of Clinical Neurosciences, University of Cambridge, Cambridge, UK, UCL Queen Square Institute of Neurology, London, UK,, Erasmus Medical Centre, Rotterdam, Netherlands, Institut d’Investigacións Biomèdiques August Pi I Sunyer, University of Barcelona, Barcelona, Spain, UCL Hawkes Institute, London, UK, .
Part of Topic
Brain Age Gap Estimate As A Predictor Of Symptom Onset In Genetic Frontotemporal Dementia
0610
E Drazich-Taylor1, M Bocchetta1, A Bouzigues1, E Ferry-Bolder1, E Cullen1, L L Russell1, P H Foster1, J Van Swieten2, L Jiskoot2, H Seelaar2, R Sánchez-Valle3, R Laforce4, C Graff5, D Galimberti6, R Vandenberghe7, A de Mendonça8, I Santana9, A Gerhard10,11, J Levin12,13, M Otto14, T Lebouvier15, M Bertoux15,16, S Ducharme17,18, I Le Ber19, E Finger20, M Carmela Tartaglia21, M Masellis22, M Synofzik23,24, F Moreno25, B Borroni26, J Rowe27, J H Cole28, J D Rohrer1, D Cash1, Genetic FTD Initiative.
Key Message
MRI-based Brain Age Gap Estimate predicts progression in C9orf72 genetic FTD only
Introduction
Genetic frontotemporal dementia (g-FTD) is a young onset dementia caused by mutations in C9orf72, GRN, and MAPT genes. These cases provide an opportunity to detect pathological changes during the presymptomatic stage1. In C9orf72 neuroimaging reveals early diffuse changes whereas GRN and MAPT show more focal patterns. However, no biomarkers are sensitive enough to detect proximity to symptom onset at an individual level. We explored whether a machine learning derived biomarker for brain age could be predictive of time to symptom onset. This robust measure has been associated various conditions but has not been explored in g-FTD2.
Methods
•Study population: 866 participants from the GENetic FTD Initiative (GENFI), a global multi-centre study of g-FTD.
•Carriers (n=647) and non-carriers (n=239) were categorised by NACC-CDR+FTLD-NM-GLOBAL scores (Table):
•Stable: score remained 0, 0.5, or >0.5 across all visits,
•Progressor: score increased across visits, or
•Mixed if score fluctuated across visits.
•Brain age analyses were conducted using brainageR v 2.12.
•Brain age gap estimate (BAGE) was calculated as “brain predicted age - chronological age”.
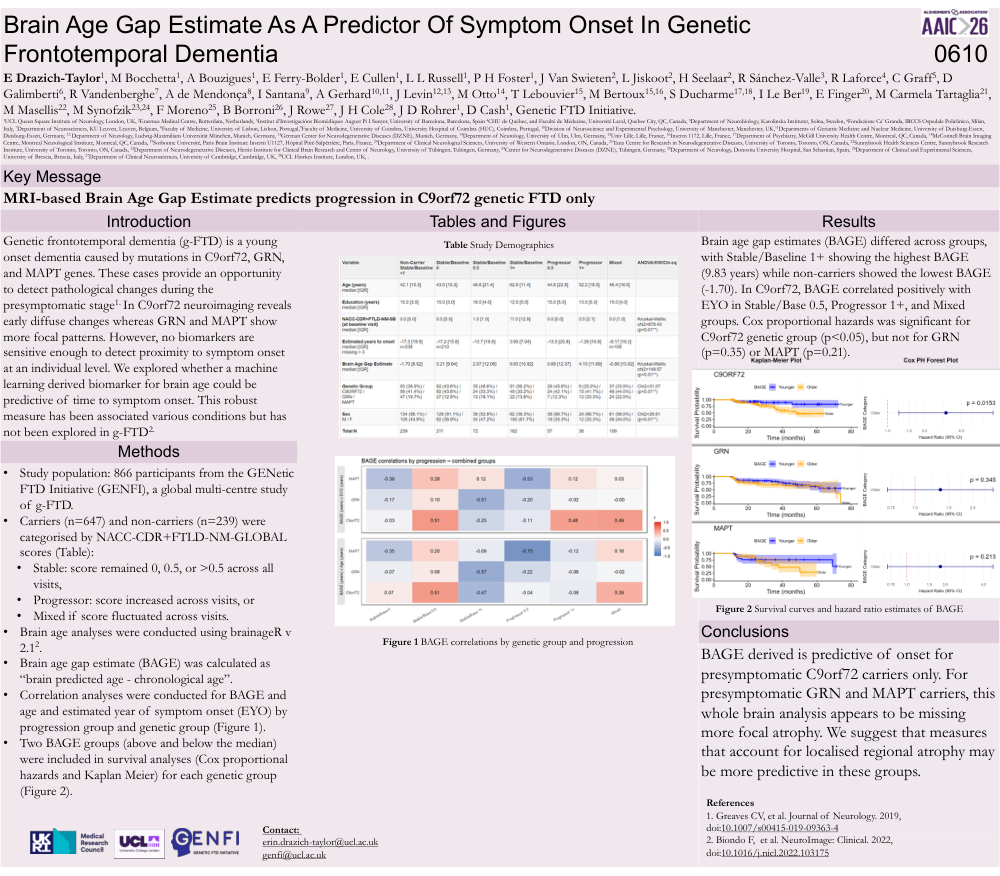
•Correlation analyses were conducted for BAGE and age and estimated year of symptom onset (EYO) by progression group and genetic group (Figure 1).
•Two BAGE groups (above and below the median) were included in survival analyses (Cox proportional hazards and Kaplan Meier) for each genetic group (Figure 2).
Results
Brain age gap estimates (BAGE) differed across groups, with Stable/Baseline 1+ showing the highest BAGE (9.83 years) while non-carriers showed the lowest BAGE (-1.70). In C9orf72, BAGE correlated positively with EYO in Stable/Base 0.5, Progressor 1+, and Mixed groups. Cox proportional hazards was significant for C9orf72 genetic group (p<0.05), but not for GRN (p=0.35) or MAPT (p=0.21).
Conclusions
BAGE derived is predictive of onset for presymptomatic C9orf72 carriers only. For presymptomatic GRN and MAPT carriers, this whole brain analysis appears to be missing more focal atrophy. We suggest that measures that account for localised regional atrophy may be more predictive in these groups.
Comments
Email is required but is not shown publicly.
Loading comments...