4,068 posters, 219 videos, 101 topics, 69 sessions, 14,365 authors, 6,128 institutions
ePostersLive by SciGen Technologies S.A. All rights reserved.
Alzheimer's Association International Conference 2026
July 12-15, 2026 | London, United Kingdom, and Online

9138
Increased Grey Matter T1w/t2w Ratio Observed In Ftd Patients
Poster Presenter
Authors
Hyunwoo Lee, Ian R A Mackenzie, Mirza Faisal Beg, Karteek Popuri, Elizabeth Finger, Simon Ducharme, Carmela Tartaglia, Robert Laforce, Mario Masellis, Ging-Yuek Robin Hsiung
Affiliations
Division of Neurology, Dept of Medicine, University of British Columbia, Canada, Dept of Pathology and Laboratory Medicine, Faculty of Medicine, University of British Columbia, Canada, School of Engineering Science, Simon Fraser University, Canada, Dept of Computer Science, Memorial University of Newfoundland, Canada, Dept of Clinical Neurological Sciences, Western University, Canada, Dept of Neurology and Neurosurgery, McGill University, Canada, Tanz Centre for Research in Neurodegenerative Diseases, University of Toronto, Canada, Dept of Medicine, Universite Laval, Canada, Division of Neurology, Department of Medicine, University of Toronto
Part of Topic
Introduction
• Frontotemporal dementia (FTD) presents with heterogeneous, progressive
deficits in behavior, language, and cognition.1
• FTD is associated with structural changes in the brain,2 including grey matter
(GM) volume loss on MRI.
• However, GM volume loss lacks specificity to detect subtle microstructural
alterations observed in early-stage FTD, such as demyelination, inflammation,
and iron accumulation. The ratio of T1-weighted and T2-weighted images on
MRI (T1w/T2w) has been proposed as an in vivo proxy for overall
microstructural integrity.3
Hypothesis
We hypothesized that FTD patients would exhibit altered T1w/T2w in
subcortical and cortical GM compared to healthy controls.
Methods
• All participants consented to be a part of the Canadian Consortium on
Neurodegeneration in Aging (CCNA) COMPASS-ND Study.4 The participants
underwent neuroimaging, neurological, cognitive and neuropsychological
assessments.
• For this study, we only selected participants who were diagnosed with FTD
(N=38) or who were recruited as cognitively normal controls (N=118).
• Mean age ± SD at baseline: FTD (67y±12), Controls (65y±11).
• Sex: FTD (55% F), Controls (60% F).
• Specific FTD types included behavioral variant FTD (n=16), Agrammatic
Nonfluent Primary Progressive Aphasia (PPA) (n=10), Semantic PPA (n=3),
Logopenic variant PPA (n=3), Corticobasal syndrome (CBS) nonfluent PPA
(n=1), Unspecified PPA (n=1), and Progressive Supranuclear Palsy (PSP) (n=4).
• T1w and T2w MRI scans were acquired using 3T scanners according to the
Canadian Dementia Imaging Protocol.5
• T1w and T2w images were spatially coregistered, followed by intensity
standardization. Average T1w/T2w ratios were calculated within GM regions of
interest defined by the Harvard-Oxford Atlases.
• This was a cross-sectional analysis using baseline images.
• General linear models were used to conduct group comparisons. The models
were adjusted for age, sex, symptomatic status, and volumes of GM, white
matter (WM), and WM hyperintensities.
Results
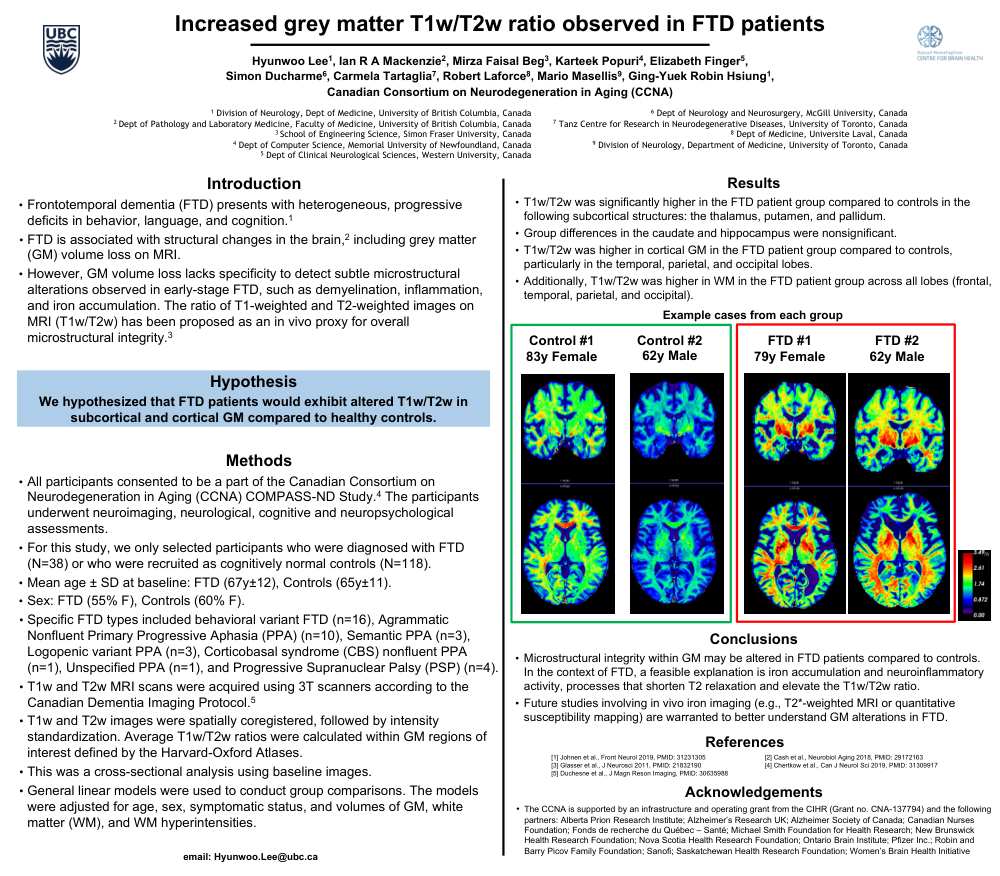
• T1w/T2w was significantly higher in the FTD patient group compared to controls in the
following subcortical structures: the thalamus, putamen, and pallidum.
• Group differences in the caudate and hippocampus were nonsignificant.
• T1w/T2w was higher in cortical GM in the FTD patient group compared to controls,
particularly in the temporal, parietal, and occipital lobes.
• Additionally, T1w/T2w was higher in WM in the FTD patient group across all lobes (frontal,
temporal, parietal, and occipital).
Conclusions
• Microstructural integrity within GM may be altered in FTD patients compared to controls.
In the context of FTD, a feasible explanation is iron accumulation and neuroinflammatory
activity, processes that shorten T2 relaxation and elevate the T1w/T2w ratio.
• Future studies involving in vivo iron imaging (e.g., T2*-weighted MRI or quantitative
susceptibility mapping) are warranted to better understand GM alterations in FTD.
References
[1] Johnen et al., Front Neurol 2019, PMID: 31231305
[2] Cash et al., Neurobiol Aging 2018, PMID: 29172163
[3] Glasser et al., J Neurosci 2011, PMID: 21832190
[4] Chertkow et al., Can J Neurol Sci 2019, PMID: 31309917
[5] Duchesne et al., J Magn Reson Imaging, PMID: 30635988
Acknowledgements
• The CCNA is supported by an infrastructure and operating grant from the CIHR (Grant no. CNA-137794) and the following
partners: Alberta Prion Research Institute; Alzheimer’s Research UK; Alzheimer Society of Canada; Canadian Nurses
Foundation; Fonds de recherche du Québec – Santé; Michael Smith Foundation for Health Research; New Brunswick
Health Research Foundation; Nova Scotia Health Research Foundation; Ontario Brain Institute; Pfizer Inc.; Robin and
Barry Picov Family Foundation; Sanofi; Saskatchewan Health Research Foundation; Women’s Brain Health Initiative
Comments
Email is required but is not shown publicly.
Loading comments...