4,068 posters, 219 videos, 101 topics, 69 sessions, 14,365 authors, 6,128 institutions
ePostersLive by SciGen Technologies S.A. All rights reserved.
Alzheimer's Association International Conference 2026
July 12-15, 2026 | London, United Kingdom, and Online

2769
Dynamic Light Scattering Spectroscopy And The Centiloid Scale
Poster Presenter
Authors
Part of Topic
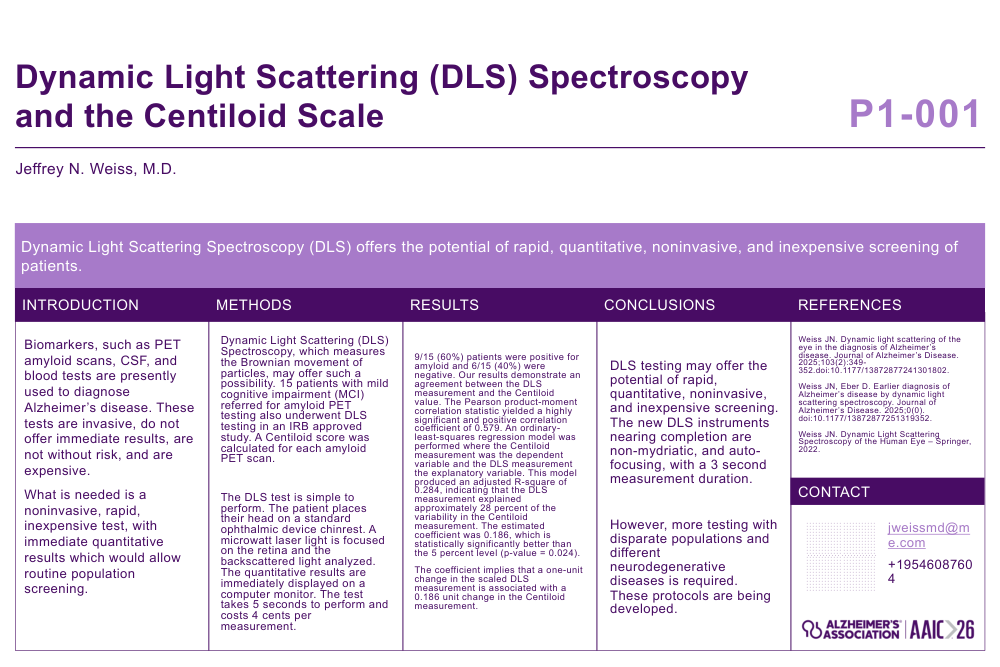
Dynamic Light Scattering (DLS) Spectroscopy and the Centiloid Scale
Jeffrey N. Weiss, M.D. jweissmd@me.com
Dynamic Light Scattering Spectroscopy (DLS) offers the potential of rapid, quantitative, noninvasive, and inexpensive screening of patients.
Introduction
Biomarkers, such as PET amyloid scans, CSF, and blood tests are presently used to diagnose Alzheimer’s disease. These tests are invasive, do not offer immediate results, are not without risk, and are expensive.
What is needed is a noninvasive, rapid, inexpensive test, with immediate quantitative results which would allow routine population screening.
Methods
Dynamic Light Scattering (DLS) Spectroscopy, which measures the Brownian movement of particles, may offer such a possibility. 15 patients with mild cognitive impairment (MCI) referred for amyloid PET testing also underwent DLS testing in an IRB approved study. A Centiloid score was calculated for each amyloid PET scan. The DLS test is simple to perform. The patient places their head on a standard ophthalmic device chinrest. A microwatt laser light is focused on the retina and the backscattered light analyzed. The quantitative results are immediately displayed on a computer monitor. The test takes 5 seconds to perform and costs 4 cents per measurement.
Results
9/15 (60%) patients were positive for amyloid and 6/15 (40%) were negative. Our results demonstrate an agreement between the DLS measurement and the Centiloid value. The Pearson product-moment correlation statistic yielded a highly significant and positive correlation coefficient of 0.579. An ordinary-least-squares regression model was performed where the Centiloid measurement was the dependent variable and the DLS measurement the explanatory variable. This model produced an adjusted R-square of 0.284, indicating that the DLS measurement explained approximately 28 percent of the variability in the Centiloid measurement. The estimated coefficient was 0.186, which is statistically significantly better than the 5 percent level (p-value = 0.024).
The coefficient implies that a one-unit change in the scaled DLS measurement is associated with a 0.186 unit change in the Centiloid measurement.
Conclusion
DLS testing may offer the potential of rapid, quantitative, noninvasive, and inexpensive screening. The new DLS instruments nearing completion are non-mydriatic, and auto-focusing, with a 3 second measurement duration.However, more testing with disparate populations and different neurodegenerative diseases is required. These protocols are being developed.
Comments
Email is required but is not shown publicly.
Loading comments...