4,068 posters, 219 videos, 101 topics, 69 sessions, 14,365 authors, 6,128 institutions
ePostersLive by SciGen Technologies S.A. All rights reserved.
Alzheimer's Association International Conference 2026
July 12-15, 2026 | London, United Kingdom, and Online

1678
Cortical Atrophy Profiles For Plasma NfL, TauC2, And GFAP In Cognitively Unimpaired Older Adults
Poster Presenter
Authors
Affiliations
Part of Topic
Background:
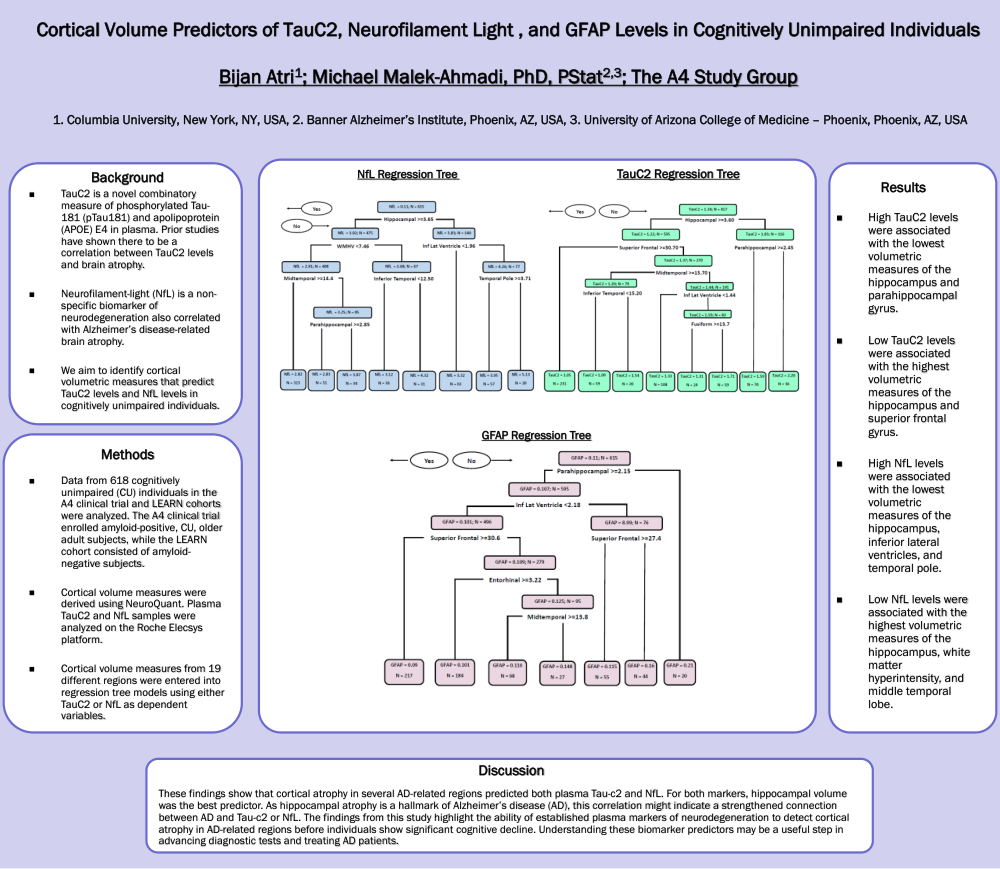
Neurofilament-light (NfL) is a non-specific biomarker of neurodegeneration that also correlated with AD-related brain atrophy and is also detectable in the preclinical stage of AD. TauC2 is a novel marker that combines phospho-tau (p-tau) 181 and APOE expression levels and may also be useful indicator AD pathology in the preclinical stage. Glial fibrillary acidic protein (GFAP) is a marker of astrocyte activity and may reflect the presence of neuroinflammation. The aim of this study was to characterize MRI-based cortical atrophy patterns associated with plasma NfL,TauC2, and GFAP in cognitively unimpaired (CU) older adults.
Methods:
Data from 618 CU individuals who participated in the A4 prevention trial and LEARN cohorts were analyzed. The A4 clinical trial enrolled amyloid-positive CU older adult subjects while the LEARN cohort consisted of amyloid-negative subjects. Cortical volume measures, corrected for intracranial volume, were used to assess atrophy and were derived using NeuroQuant. Plasma samples for NfL, TauC2, and GFAP were analyzed on the Roche Elecsys platform. Regression tree analysis was used to construct cortical atrophy profiles for NfL, TauC2, GFAP using volumetric measures from 19 different regions. Mean square error (MSE) values for the terminal nodes of each regression tree were used to assess model fit.
Results:
Low NfL was associated with greater hippocampal, lower white matter hyper intenstity, and greater midtemporal cortex volumes while higher NfL levels corresponded with lower hippocampal, greater ventricle, and lower temporal volumes. Greater hippocampal and superior frontal cortex volumes corresponded with the lowest TauC2 levels while lower hippocampal and parahippocampal volumes were associated with the highest TauC2 levels. Higher GFAP levels corresponded with lower hippocampal volume while greater parahippocampal, lower ventricle, and greater superior frontal volumes were associated with the lowest GFAP levels.
Conclusion:
The findings from this study highlight the ability of established plasma markers of neurodegeneration to detect cortical atrophy in AD-related regions before individuals show significant cognitive decline. While there are many differences in the cortical atrophy profiles for NfL, TauC2, and GFAP, both the hippocampus and the parahippocampal gyrus featured prominently in each profile, underscoring their importance in the earliest stages of AD.
Comments
Email is required but is not shown publicly.
Loading comments...