4,068 posters, 219 videos, 101 topics, 69 sessions, 14,365 authors, 6,128 institutions
ePostersLive by SciGen Technologies S.A. All rights reserved.
Alzheimer's Association International Conference 2026
July 12-15, 2026 | London, United Kingdom, and Online

2005
Microglia-neuron Interactions In A TDP-43 Mouse Model Of Neurodegenerative Disease
Poster Presenter
Authors
Affiliations
Part of Topic
Introduction
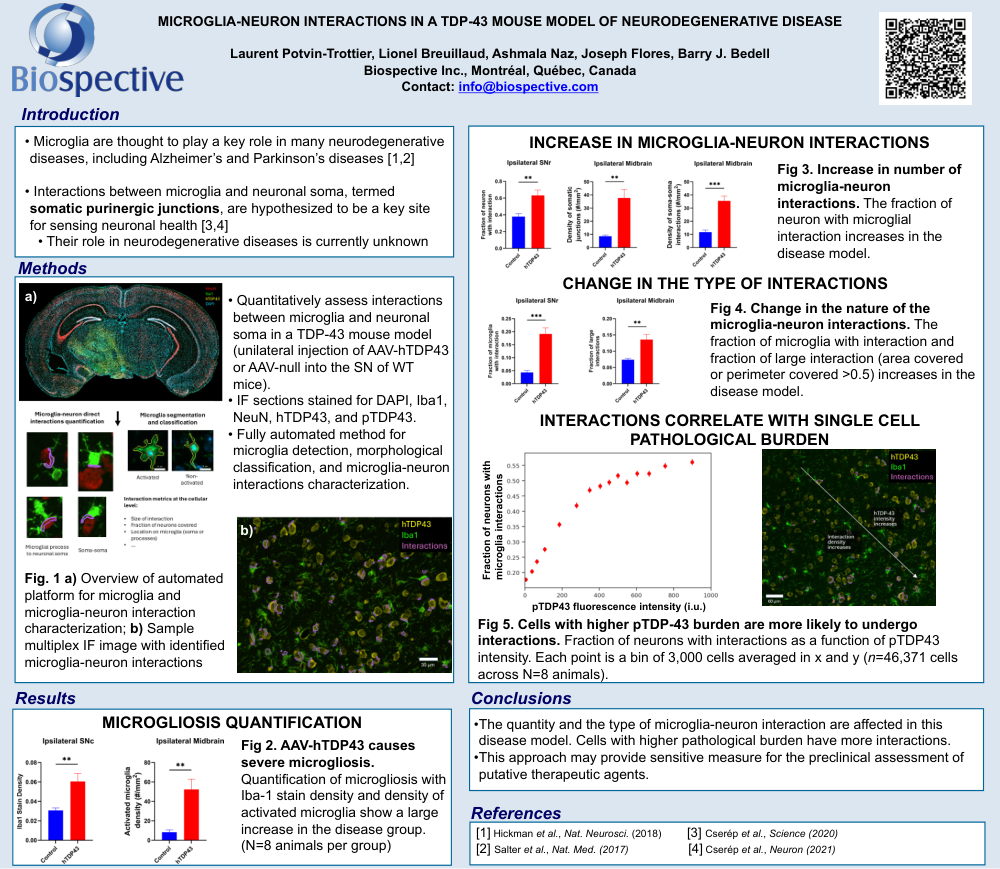
Fig. 1 a) Overview of automated platform for microglia and microglia-neuron interaction characterization; b) Sample multiplex IF image with identified microglia-neuron interactions
Results
MICROGLIOSIS QUANTIFICATION
Fig 2. AAV-hTDP43 causes severe microgliosis. Quantification of microgliosis with Iba-1 stain density and density of activated microglia show a large increase in the disease group. (N=8 animals per group)
INCREASE IN MICROGLIA-NEURON INTERACTIONS
Fig 3. Increase in number of microglia-neuron interactions. The fraction of neuron with microglial interaction increases in the disease model.
CHANGE IN THE TYPE OF INTERACTIONS
Fig 4. Change in the nature of the microglia-neuron interactions. The fraction of microglia with interaction and fraction of large interaction (area covered or perimeter covered >0.5) increases in the disease model.
INTERACTIONS CORRELATE WITH SINGLE CELL PATHOLOGICAL BURDEN
Fig 5. Cells with higher pTDP-43 burden are more likely to undergo interactions. Fraction of neurons with interactions as a function of pTDP43 intensity. Each point is a bin of 3,000 cells averaged in x and y (n=46,371 cells across N=8 animals).
Conclusions
Comments
Email is required but is not shown publicly.
Loading comments...