4,068 posters, 219 videos, 101 topics, 69 sessions, 14,365 authors, 6,128 institutions
ePostersLive by SciGen Technologies S.A. All rights reserved.
Alzheimer's Association International Conference 2026
July 12-15, 2026 | London, United Kingdom, and Online

873
Cognitive Profile Accurately Predicts Underlying Pathology In Corticobasal Syndrome.
Poster Presenter
Authors
Steven Smithies, Amir Ebneabbasi, Riccardo Conci, Alexander Murley, George Savulich, Katherine Stockton, Matthew Rouse, Michelle Naessens, Maura Malpetti, Timothy Rittman, Kieren Allinson, Annelies Quaegebeur, James Rowe, Negin Holland
Affiliations
University of Cambridge, Cambridge University Hospitals NHS Foundation Trust
Part of Topic
Cognitive profiling accurately predicts underlying pathology in the Corticobasal Syndrome
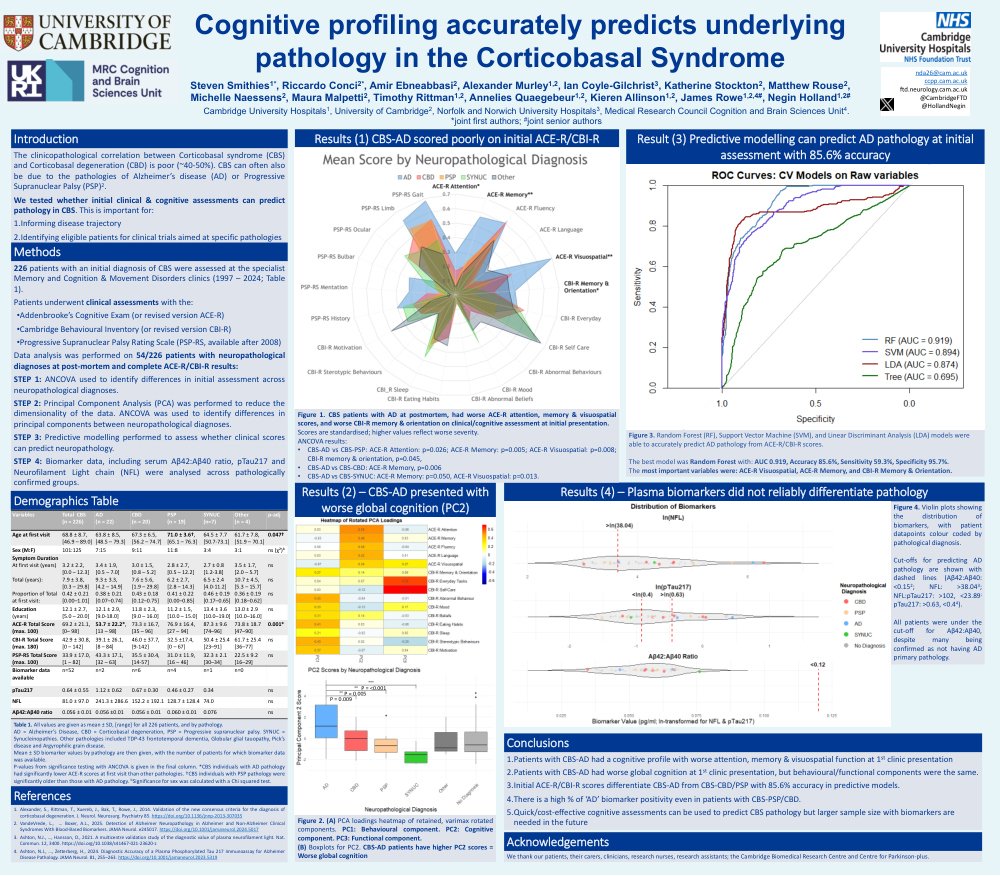
The clinicopathological correlation between Corticobasal syndrome (CBS) and Corticobasal degeneration (CBD) is poor (~50%). CBS can often also be due to the pathologies of Alzheimer’s disease (AD) or Progressive Supranuclear Palsy (PSP)2.
We tested whether initial clinical assessments can predict pathology in CBS. This is important for:
1. Informing disease trajectory
2. Identifying eligible patients for clinical trials aimed at specific pathologies
226 patients with an initial diagnosis of CBS were assessed at the specialist Memory and Cognition & Movement Disorders clinics (1997 – 2024; Table 1).
Patients underwent clinical assessments with the:
• Addenbrooke’s Cognitive Exam (or revised version ACE-R)
• Cambridge Behavioural Inventory (or revised version CBI-R)
• Progressive Supranuclear Palsy Rating Scale (PSP-RS, available after 2008)
Data analysis was performed on 54/226 patients with neuropathological diagnoses at post-mortem and complete ACE-R/CBI-R results:
STEP 1: ANCOVA used to identify differences in initial assessment across neuropathological diagnoses.
STEP 2: Principal Component Analysis (PCA) was performed to reduce the dimensionality of the data. ANCOVA was used to identify differences in principal components between neuropathological diagnoses.
STEP 3: Predictive modelling performed to assess whether clinical scores can predict neuropathology.
STEP 4: Biomarker data, including serum Aβ42:Aβ40 ratio, pTau217 and Neurofilament Light chain (NFL) were analysed across pathologically confirmed groups.
Table 1. All values are given as mean ± SD, [range] for all 226 patients, and by pathology.
AD = Alzheimer’s Disease, CBD = Corticobasal degeneration, PSP = Progressive supranuclear palsy. SYNUC = Synucleinopathies. Other pathologies included TDP-43 frontotemporal dementia, Globular glial tauopathy, Pick’s disease and Argyrophilic grain disease.
Mean ± SD biomarker values by pathology are then given, with the number of patients for which biomarker data was available.
P-values from significance testing with ANCOVA is given in the final column. *CBS individuals with AD pathology had significantly lower ACE-R scores at first visit than other pathologies. †CBS individuals with PSP pathology were significantly older than those with AD pathology. bSignificance for sex was calculated with a Chi squared test.
Figure 1. Scores are standardised; higher values reflect worse severity. CBS-AD patients have worse ACE-R attention, memory & visuospatial scores, and worse CBI-R memory & orientation.
ANCOVA results:
• CBS-AD vs CBS-PSP: ACE-R Attention: p=0.026; ACE-R Memory: p=0.005; ACE-R Visuospatial: p=0.008; CBI-R memory & orientation, p=0.045,
• CBS-AD vs CBS-CBD: ACE-R Memory, p=0.006
• CBS-AD vs CBS-SYNUC: ACE-R Memory: p=0.050, ACE-R Visuospatial: p=0.013.
P values adjusted for multiple comparisons (Tukey).
Figure 2. (A) PCA loadings heatmap of retained, varimax rotated components. PC1: Behavioural component. PC2: Cognitive component. PC3: Functional component.
(B) Boxplots for PC2. CBS-AD patients have higher PC2 scores = Worse global cognition
Figure 3. Random Forest (RF), Support Vector Machine (SVM), and Linear Discriminant Analysis (LDA) models were able to accurately predict AD pathology from ACE-R/CBI-R scores.
The best model was Random Forest with: AUC 0.919, Accuracy 85.6%, Sensitivity 59.3%, Specificity 95.7%.
The most important variables were: ACE-R Visuospatial, ACE-R Memory, and CBI-R Memory & Orientation.
Figure 4. Violin plots showing the distribution of biomarkers, with patient datapoints colour coded by pathological diagnosis.
Cut-offs for predicting AD pathology are shown with dashed lines (Aβ42:Aβ40: <0.152; NFL: >38.043; NFL:pTau217: >102, <23.89; pTau217: >0.63, <0.44).
All patients were under the cut-off for Aβ42:Aβ40, despite many being confirmed as not having AD primary pathology.
1. Patients with CBS-AD had a cognitive profile with worse attention, memory & visuospatial function at 1st clinic presentation
2. Patients with CBS-AD had worse global cognition at 1st clinic presentation, but behavioural/functional components were the same.
3. Initial ACE-R/CBI-R scores differentiate CBS-AD from CBS-CBD/PSP with 85.6% accuracy in predictive models.
4. There is a high % of ‘AD’ biomarker positivity even in patients with CBS-PSP/CBD.
5. Quick/cost-effective cognitive assessments can be used to predict CBS pathology but larger sample size with biomarkers are needed in the future
Comments
Email is required but is not shown publicly.
Loading comments...