4,068 posters, 219 videos, 101 topics, 69 sessions, 14,365 authors, 6,128 institutions
ePostersLive by SciGen Technologies S.A. All rights reserved.
Alzheimer's Association International Conference 2026
July 12-15, 2026 | London, United Kingdom, and Online

9461
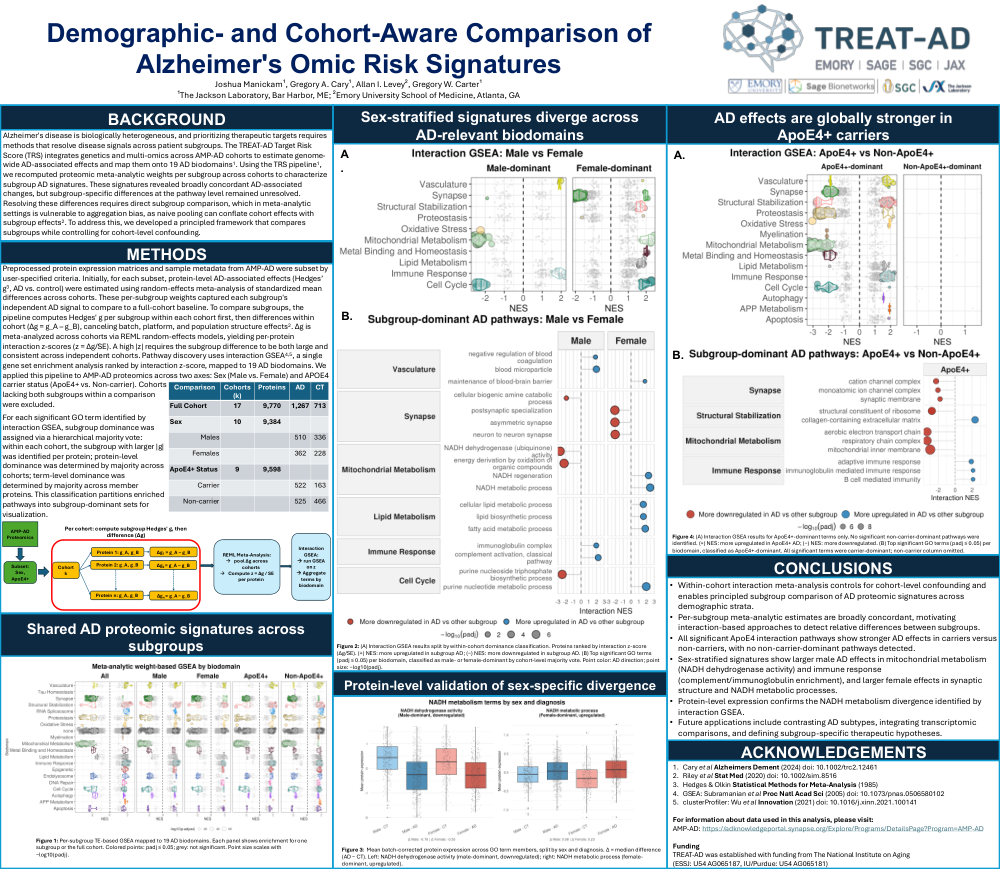
Demographic- And Cohort-aware Comparison Of Alzheimer’s Omic Risk Signatures
Poster Presenter
Part of Topic
BACKGROUND
Alzheimer's disease is biologically heterogeneous, and prioritizing therapeutic targets requires methods that resolve disease signals across patient subgroups. The TREAT-AD Target Risk Score (TRS) integrates genetics and multi-omics across AMP-AD cohorts to estimate genome-wide AD-associated effects and map them onto 19 AD biodomains1. Using the TRS pipeline1, we recomputed proteomic meta-analytic weights per subgroup across cohorts to characterize subgroup AD signatures. These signatures revealed broadly concordant AD-associated changes, but subgroup-specific differences at the pathway level remained unresolved. Resolving these differences requires direct subgroup comparison, which in meta-analytic settings is vulnerable to aggregation bias, as naive pooling can conflate cohort effects with subgroup effects2. To address this, we developed a principled framework that compares subgroups while controlling for cohort-level confounding.
METHODS
Preprocessed protein expression matrices and sample metadata from AMP-AD were subset by user-specified criteria. Initially, for each subset, protein-level AD-associated effects (Hedges’ g3, AD vs. control) were estimated using random-effects meta-analysis of standardized mean differences across cohorts. These per-subgroup weights captured each subgroup's independent AD signal to compare to a full-cohort baseline. To compare subgroups, the pipeline computes Hedges' g per subgroup within each cohort first, then differences within cohort (Δg = g_A – g_B), canceling batch, platform, and population structure effects2. Δg is meta-analyzed across cohorts via REML random-effects models, yielding per-protein interaction z-scores (z = Δg/SE). A high |z| requires the subgroup difference to be both large and consistent across independent cohorts. Pathway discovery uses interaction GSEA4,5, a single gene set enrichment analysis ranked by interaction z-score, mapped to 19 AD biodomains. We applied this pipeline to AMP-AD proteomics across two axes: Sex (Male vs. Female) and APOE4 carrier status (ApoE4+ vs. Non-carrier). Cohorts lacking both subgroups within a comparison were excluded. For each significant GO term identified by interaction GSEA, subgroup dominance was assigned via a hierarchical majority vote: within each cohort, the subgroup with larger |g| was identified per protein; protein-level dominance was determined by majority across cohorts; term-level dominance was determined by majority across member proteins. This classification partitions enriched pathways into subgroup-dominant sets for visualization.
CONCLUSIONS
Comments
Email is required but is not shown publicly.
Loading comments...