4,068 posters, 219 videos, 101 topics, 69 sessions, 14,365 authors, 6,128 institutions
ePostersLive by SciGen Technologies S.A. All rights reserved.
Alzheimer's Association International Conference 2026
July 12-15, 2026 | London, United Kingdom, and Online

13298
Validating Static PET Metrics Against Patlak-GU: Foundations For Predictive Modeling In FDG-PET
Poster Presenter
Authors
Veikka Savila, Janne Isojärvi, Petra Parviainen, Iina Hinkka, Riina Lehtonen, Leonard Klar, Tuulia Malen, Kirsi Virtanen, Heikki Hämäläinen, Matti Sillanpää, Pirjo Nuutila, Lauri Nummenmaa, Juha Rinne, Marco Bucci
Affiliations
Turku PET Centre, Turku University Hospital and University of Turku, Turku, Finland, Turku PET Centre, Turku University Hospital and University of Turku, Turku, Finland, Finland, Turku PET Centre, Turku University Hospital and University of Turku, Turku, Finland, Finland and InFLAMES Research Flagship Center, University of Turku, Turku, Finland, Turku PET Centre, Turku University Hospital and University of Turku, Turku, Finland and Department of Neurobiology, Care Sciences and Society, Centre for Alzheimer Research, Division of Clinical Geriatrics, Karolinska Institutet, SE-14183 Stockholm, Sweden
Part of Topic
Biomarkers -> Neuroimaging -> Multi-modal comparisons
Validating Static PET Metrics Against Patlak:
Foundations for Predictive Modeling in FDG-PET
Veikka Savila1, Janne Isojärvi1, Petra Parviainen1, Iina Hinkka1, Riina Lehtonen1, Leonard Klar1, Tuulia Malen1, Kirsi
Virtanen1, Heikki Hämäläinen1, Matti Sillänpää1, Pirjo Nuutila1, Lauri Nummenmaa1, Juha Rinne1,2, Marco Bucci1,3
Introduction
Of the existing non-compartmental methods to quantify the glucose
uptake based on FDG-PET images, Gjedde-Patlak is considered the
most quantitative, while Fractional Uptake Rate (FUR) is considered
semi-quantitative, where as Standardize Uptake Value (SUV) and SUV
Ratio (SUVR) are considered qualitative. Patlak requires dynamic
imaging and input functions (IF). However, static metrics such as SUV
and SUVR are easier to obtain.
Aim
In this study, we aimed to evaluate the associations between SUV,
SUVR, and FUR with Patlak Ki in a large cohort. This project
evaluates how well static PET metrics — alone or combined with
basic subject characteristics — can approximate Patlak Ki, compared
to dynamic metrics such as FUR
Methods
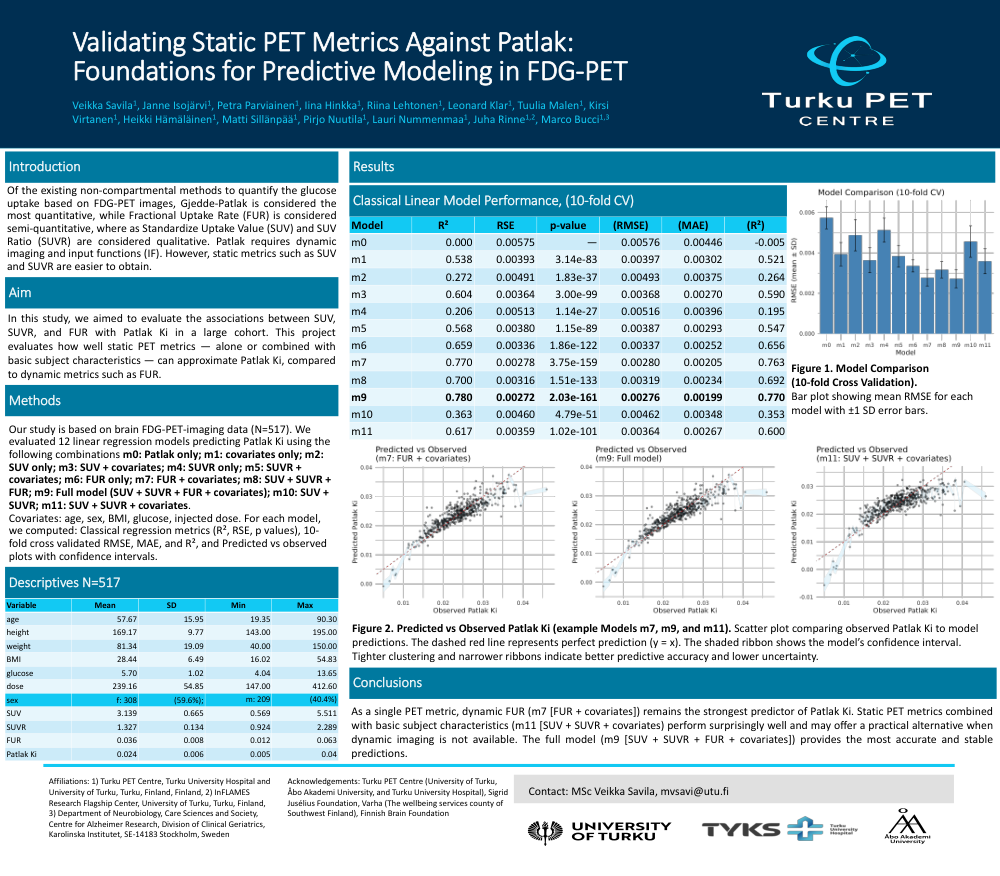
Our study is based on brain FDG-PET-imaging data (N=517). We
evaluated 12 linear regression models predicting Patlak Ki using the
following combinations m0: Patlak only; m1: covariates only; m2:
SUV only; m3: SUV + covariates; m4: SUVR only; m5: SUVR +
covariates; m6: FUR only; m7: FUR + covariates; m8: SUV + SUVR +
FUR; m9: Full model (SUV + SUVR + FUR + covariates); m10: SUV +
SUVR; m11: SUV + SUVR + covariates.
Covariates: age, sex, BMI, glucose, injected dose. For each model,
we computed: Classical regression metrics (R², RSE, p values), 10-
fold cross validated RMSE, MAE, and R², and Predicted vs observed
plots with confidence intervals
Conclusions
As a single PET metric, dynamic FUR (m7 [FUR + covariates]) remains the strongest predictor of Patlak Ki. Static PET metrics combined
with basic subject characteristics (m11 [SUV + SUVR + covariates) perform surprisingly well and may offer a practical alternative when
dynamic imaging is not available. The full model (m9 [SUV + SUVR + FUR + covariates]) provides the most accurate and stable
predictions.
Affiliations: 1) Turku PET Centre, Turku University Hospital and
University of Turku, Turku, Finland, Finland, 2) InFLAMES
Research Flagship Center, University of Turku, Turku, Finland,
3) Department of Neurobiology, Care Sciences and Society,
Centre for Alzheimer Research, Division of Clinical Geriatrics,
Karolinska Institutet, SE-14183 Stockholm, Sweden
Acknowledgements: Turku PET Centre (University of Turku,
Åbo Akademi University, and Turku University Hospital), Sigrid
Jusélius Foundation, Varha (The wellbeing services county of
Southwest Finland), Finnish Brain Foundation
Contact: MSc Veikka Savila, mvsavi@utu.fi
Figure 1. Model Comparison
(10-fold Cross Validation).
Bar plot showing mean RMSE for each
model with ±1 SD error bars.
Figure 2. Predicted vs Observed Patlak Ki (example Models m7, m9, and m11). Scatter plot comparing observed Patlak Ki to model
predictions. The dashed red line represents perfect prediction (y = x). The shaded ribbon shows the model’s confidence interval.
Tighter clustering and narrower ribbons indicate better predictive accuracy and lower uncertainty.
Comments
Email is required but is not shown publicly.
Loading comments...